Modern Attack Aircraft Evaluation
I have selected, investigated, and compared the 20 most common modern attack aircraft to assign points to each one based on ferry range, payload, cruise speed, among many other variables I call yes/no variables.
Through this little project I hope to give an idea of how these aircraft compare to each other not only by assigning points to their performance, but also by adding them up and placing them in decending order.
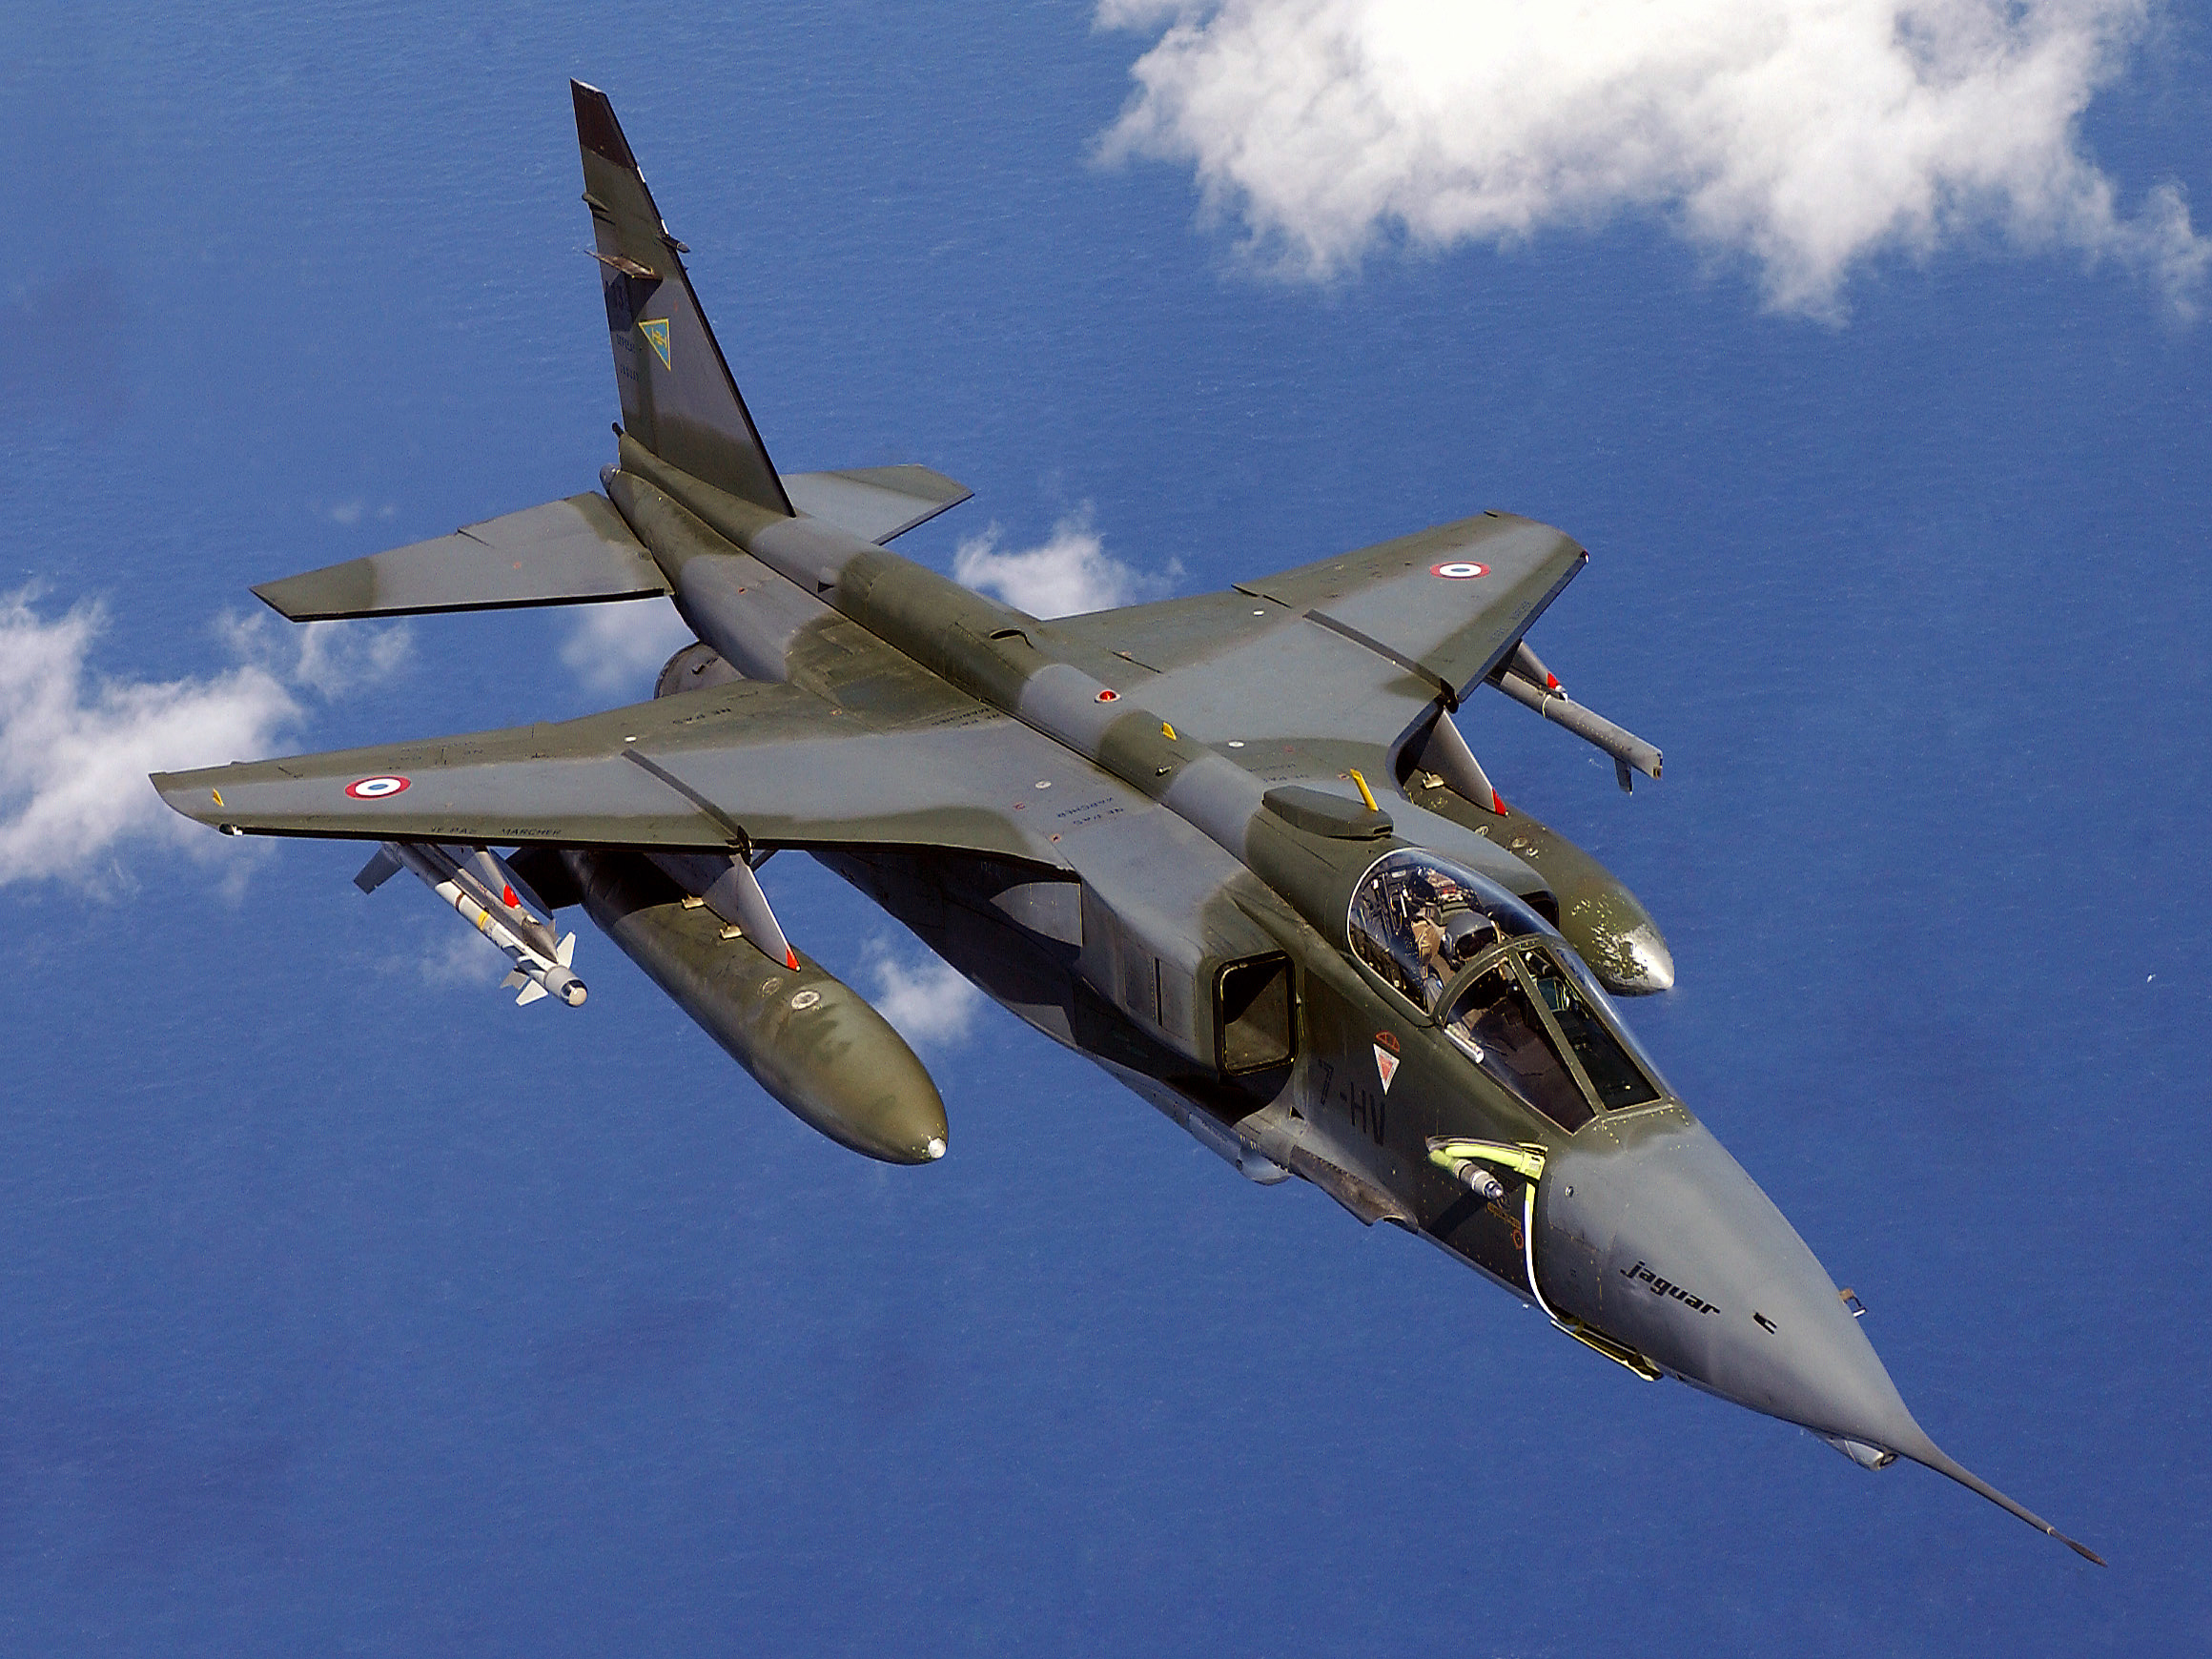
Thankfully, my favorite attack aircraft, the SEPECAT Jaguar, came in third while the PANAVIA Tornado and the Su-34 Fullback shared first and second place. All in all, the results reflected the overall goodness of each aircraft to what is in my opinion, an accurate extent. Furthermore, it was interesting to see how different types of attack aircraft such as Supersonic, Subsonic, Close Air Support, and Counter Insurgency aircraft compare to each other while maintaining ccoherence in their overall score results.
Having no experience or theoretical knowledge on how to do this sort of thing, I did have to adjust and redifine things along the way. For instance, my choice for ferry range as a criteria for the evaluation was chosen because of the incredible variability in combat range and combat radius of, well, combat aircraft. Hence, although ferry range might not sound like a relevant element for the evaluation of combat aircraft, it was the most objective and universal range measure I could select.
The yes/no variables were tackled initially by writing yes or no for each case. However, upon translating them to numbers, I decided to go beyond mere 1 or -1 and use 0 if the variable is irrelevant to the type of aircraft, -2 if that particular shortcoming is a sever disadvantage, and so on. At the end of the yes/no variable section there is an internal fuel tank usability score which scores 1 if the aircraft's internal fuel tank can be filled between 75% and 100% while having reached its maximum weapons payload and while not exceeding maximum take-off weight. Negative score was given as the usable percentage dropped.
Finally, among perhaps some other relevant comments or descriptions I might add in the future, the four main types of Harriers were blended into one called Average Harrier. Sorry for that. I also found it particularly difficult to get information on the Harriers such as an accurately described maximum take-off weight considering VTOL and STOL take-offs and most especially internal fuel tank capacity. I wonder if such capacity is a secret given the political cost of how fuel thirsty the Harrier turned out to be. Deteils on the Harriers in the excel file, link below.
So without further ado, I present to you the hopefully self-explanatory charts that led to the score given to each aircraft. Please feel free to leave your very valuable comments at the end of the page and I will gladly take them into account to improve this little project of mine. Get the excel file here
.
| No. | Name | Ferry Range (km) | Empty Weight (kg) | Weapons Payload (kg) | EW+WP (kg) | Max Take-off Weight (kg) | MTW minus EW+WP (kg) | Internal Fuel Capacity (kg) | Internal Fuel Tank Usability at Max WP (%) | Cruising Speed (km/h) | Hardpoints | Twin Engine | Carrier | Rough Field | Supersonic | Night | All Weather | Nuclear Attack | Areal Refuelling | Armour | Internal Fuel Tank Usability Score | Yes No Score | Built | Price | Introduced | Last | Production Years | Company | Country | Notes |
| 1 | A-4 SkyHawk | 3,200 | 4,750 | 4,490 | 9,240 | 11,140 | 1,900 | 5,200 | 37 | 760 | 5 | -1 | 1 | -1 | -1 | 1 | -1 | 1 | 1 | -1 | -3 | -4 | 2,960 | 3.3m | 1954 | 1979 | 25 | Douglas | USA | |
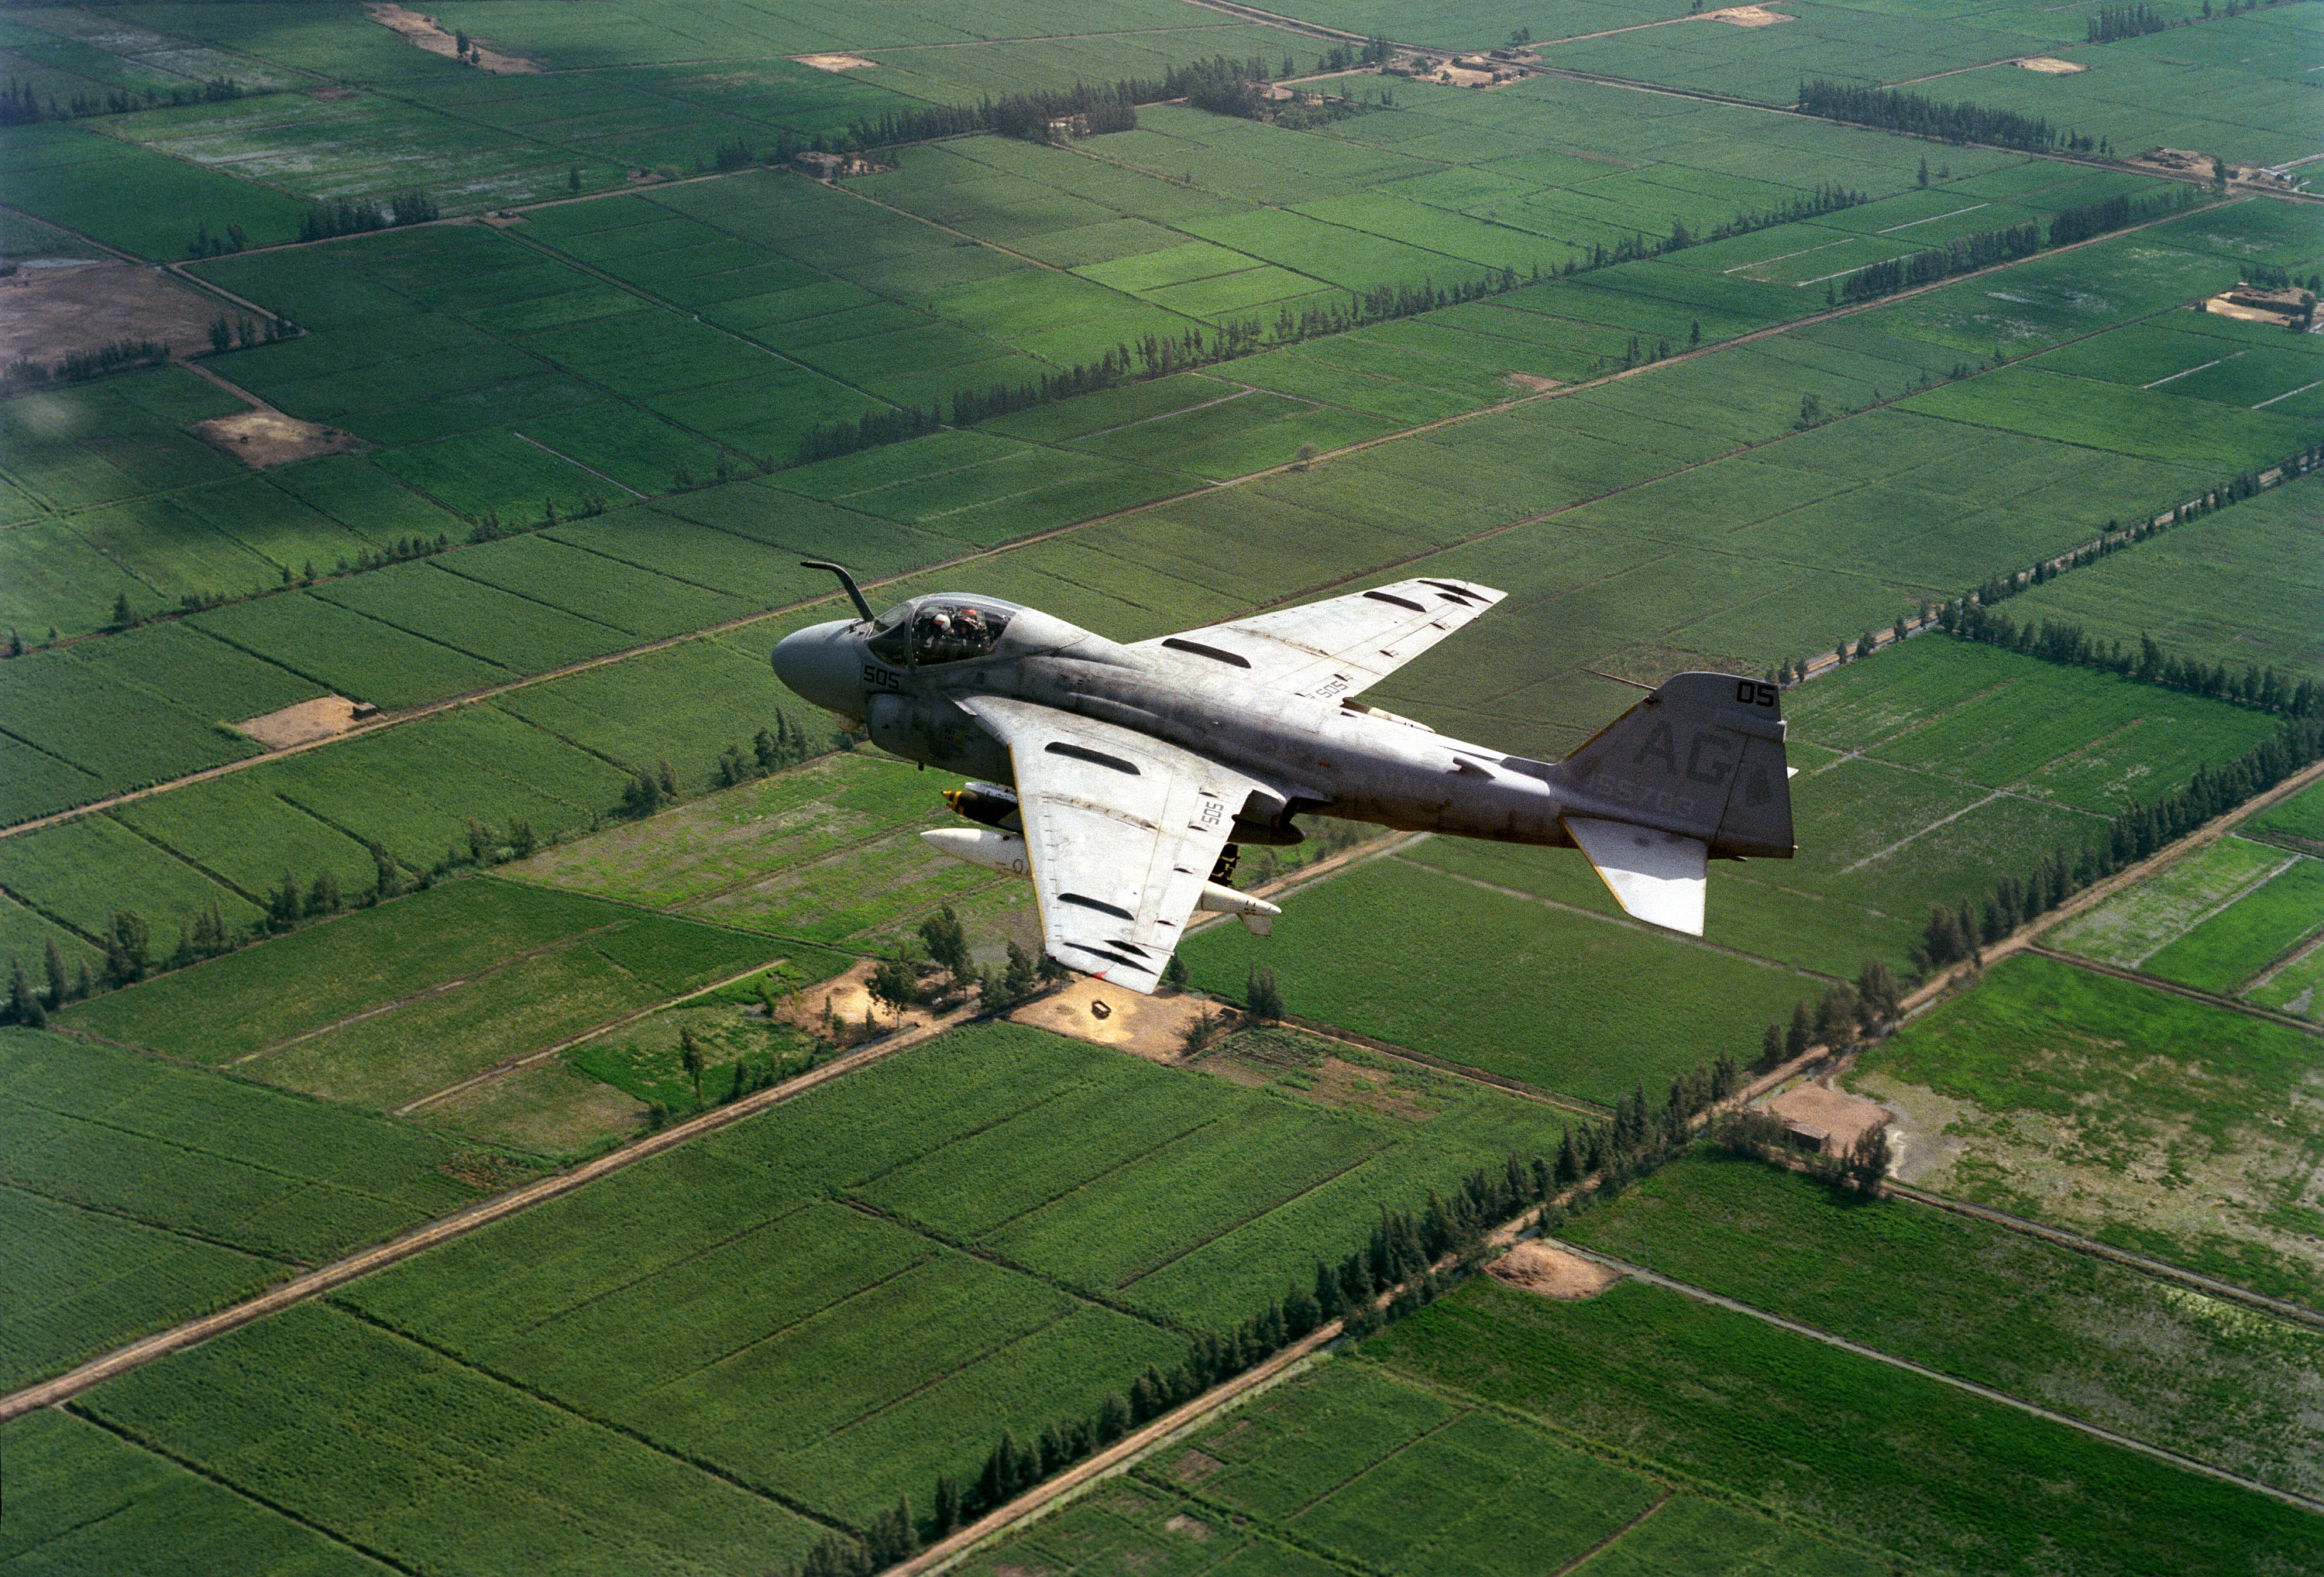
| 2 | A-6 Intruder | 5,310 | 12,000 | 8,200 | 20,200 | 27,400 | 7,200 | 7,260 | 99 | 628 | 5 | 1 | 1 | -1 | -1 | 1 | 1 | 1 | 1 | -1 | 1 | 4 | 693 | 43m | 1962 | 1990 | 28 | Grumman | USA | |
| 3 | A-37 Dragonfly | 1,480 | 2,820 | 1,230 | 4,050 | 6,350 | 2,300 | 1,510 | 100 | 790 | 8 | 1 | -1 | 2 | -1 | 1 | -1 | -1 | 1 | -1 | 1 | 1 | 620 | 0.2m | 1963 | 1975 | 12 | Cessna | USA | COIN |
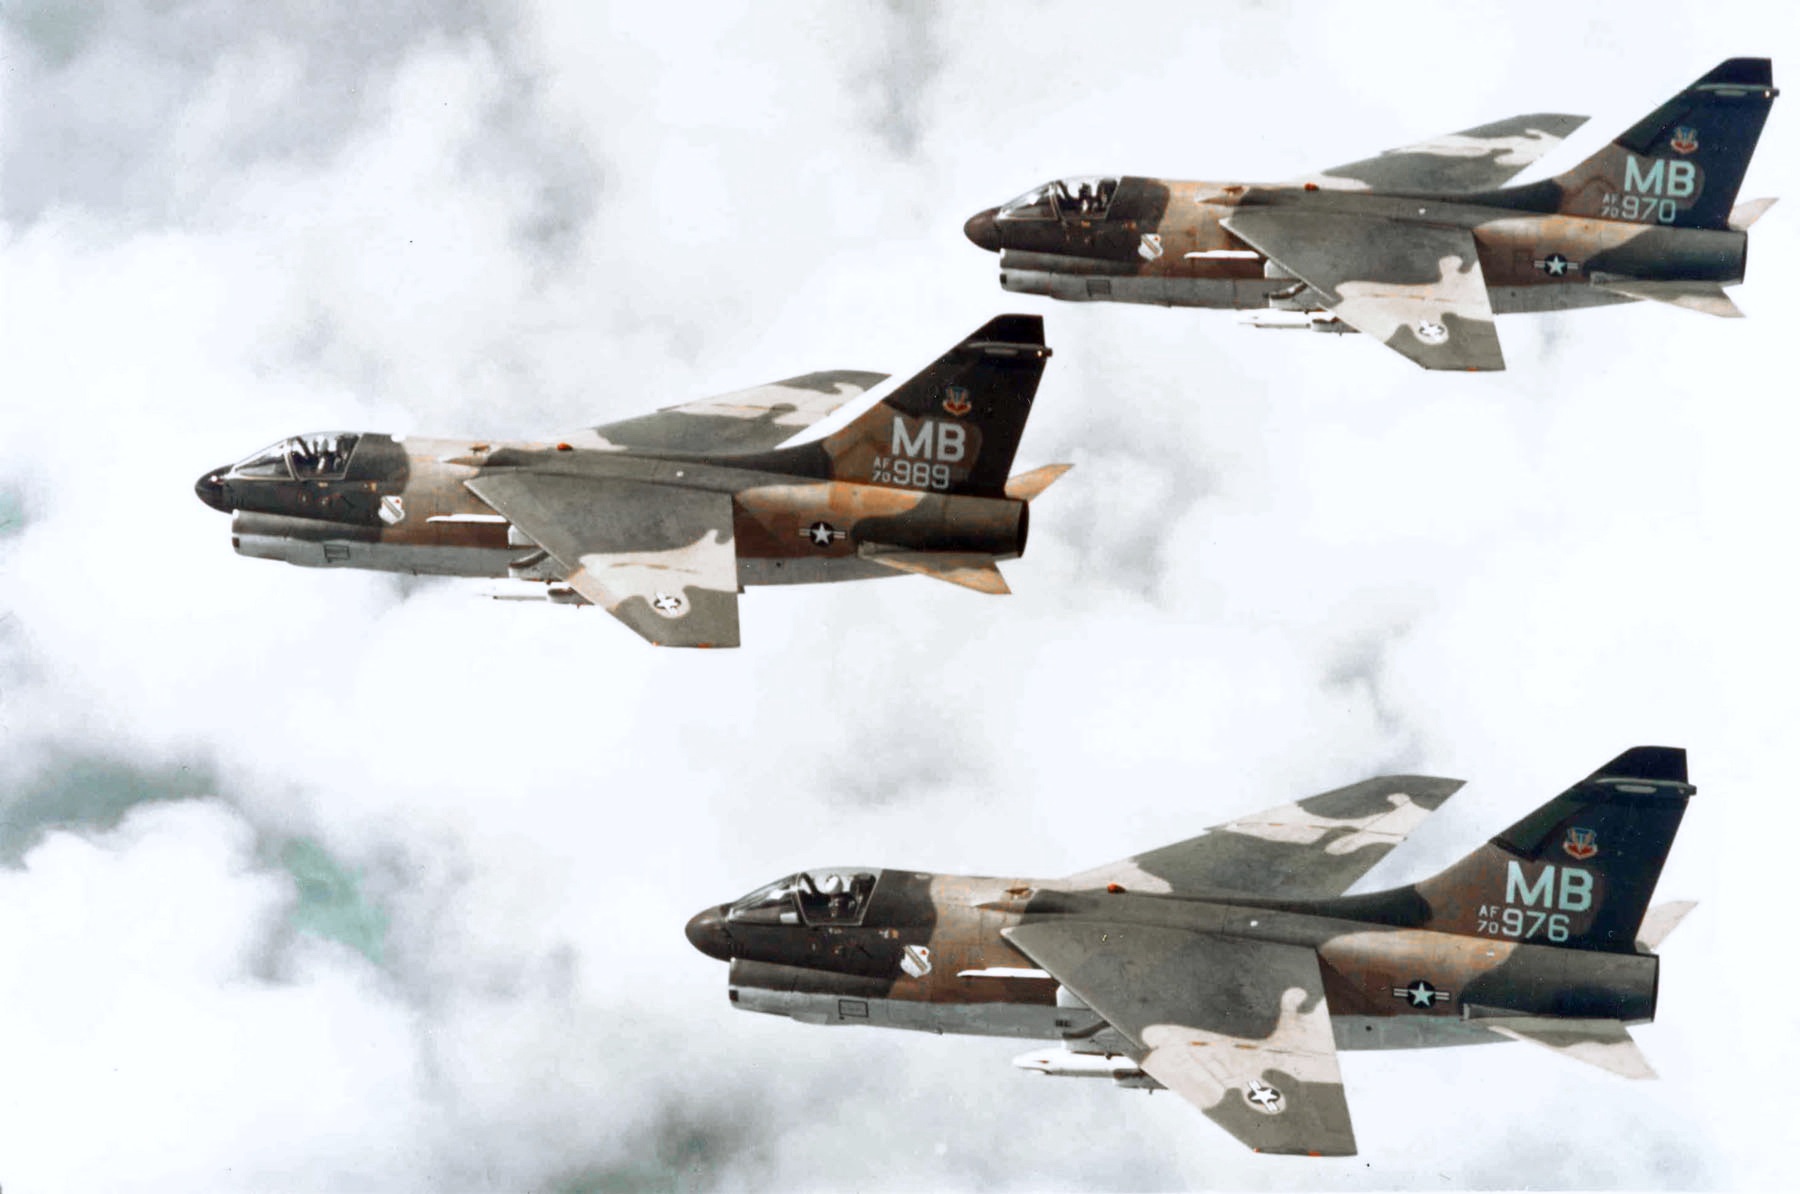
| 4 | A-7 Corsair | 5,133 | 8,680 | 6,800 | 15,480 | 19,000 | 3,520 | 4,600 | 77 | 738 | 6 | -1 | 1 | -1 | -1 | 1 | -1 | 1 | 1 | -1 | 1 | 0 | 1,569 | 2.9m | 1965 | 1984 | 19 | Vought | USA | |
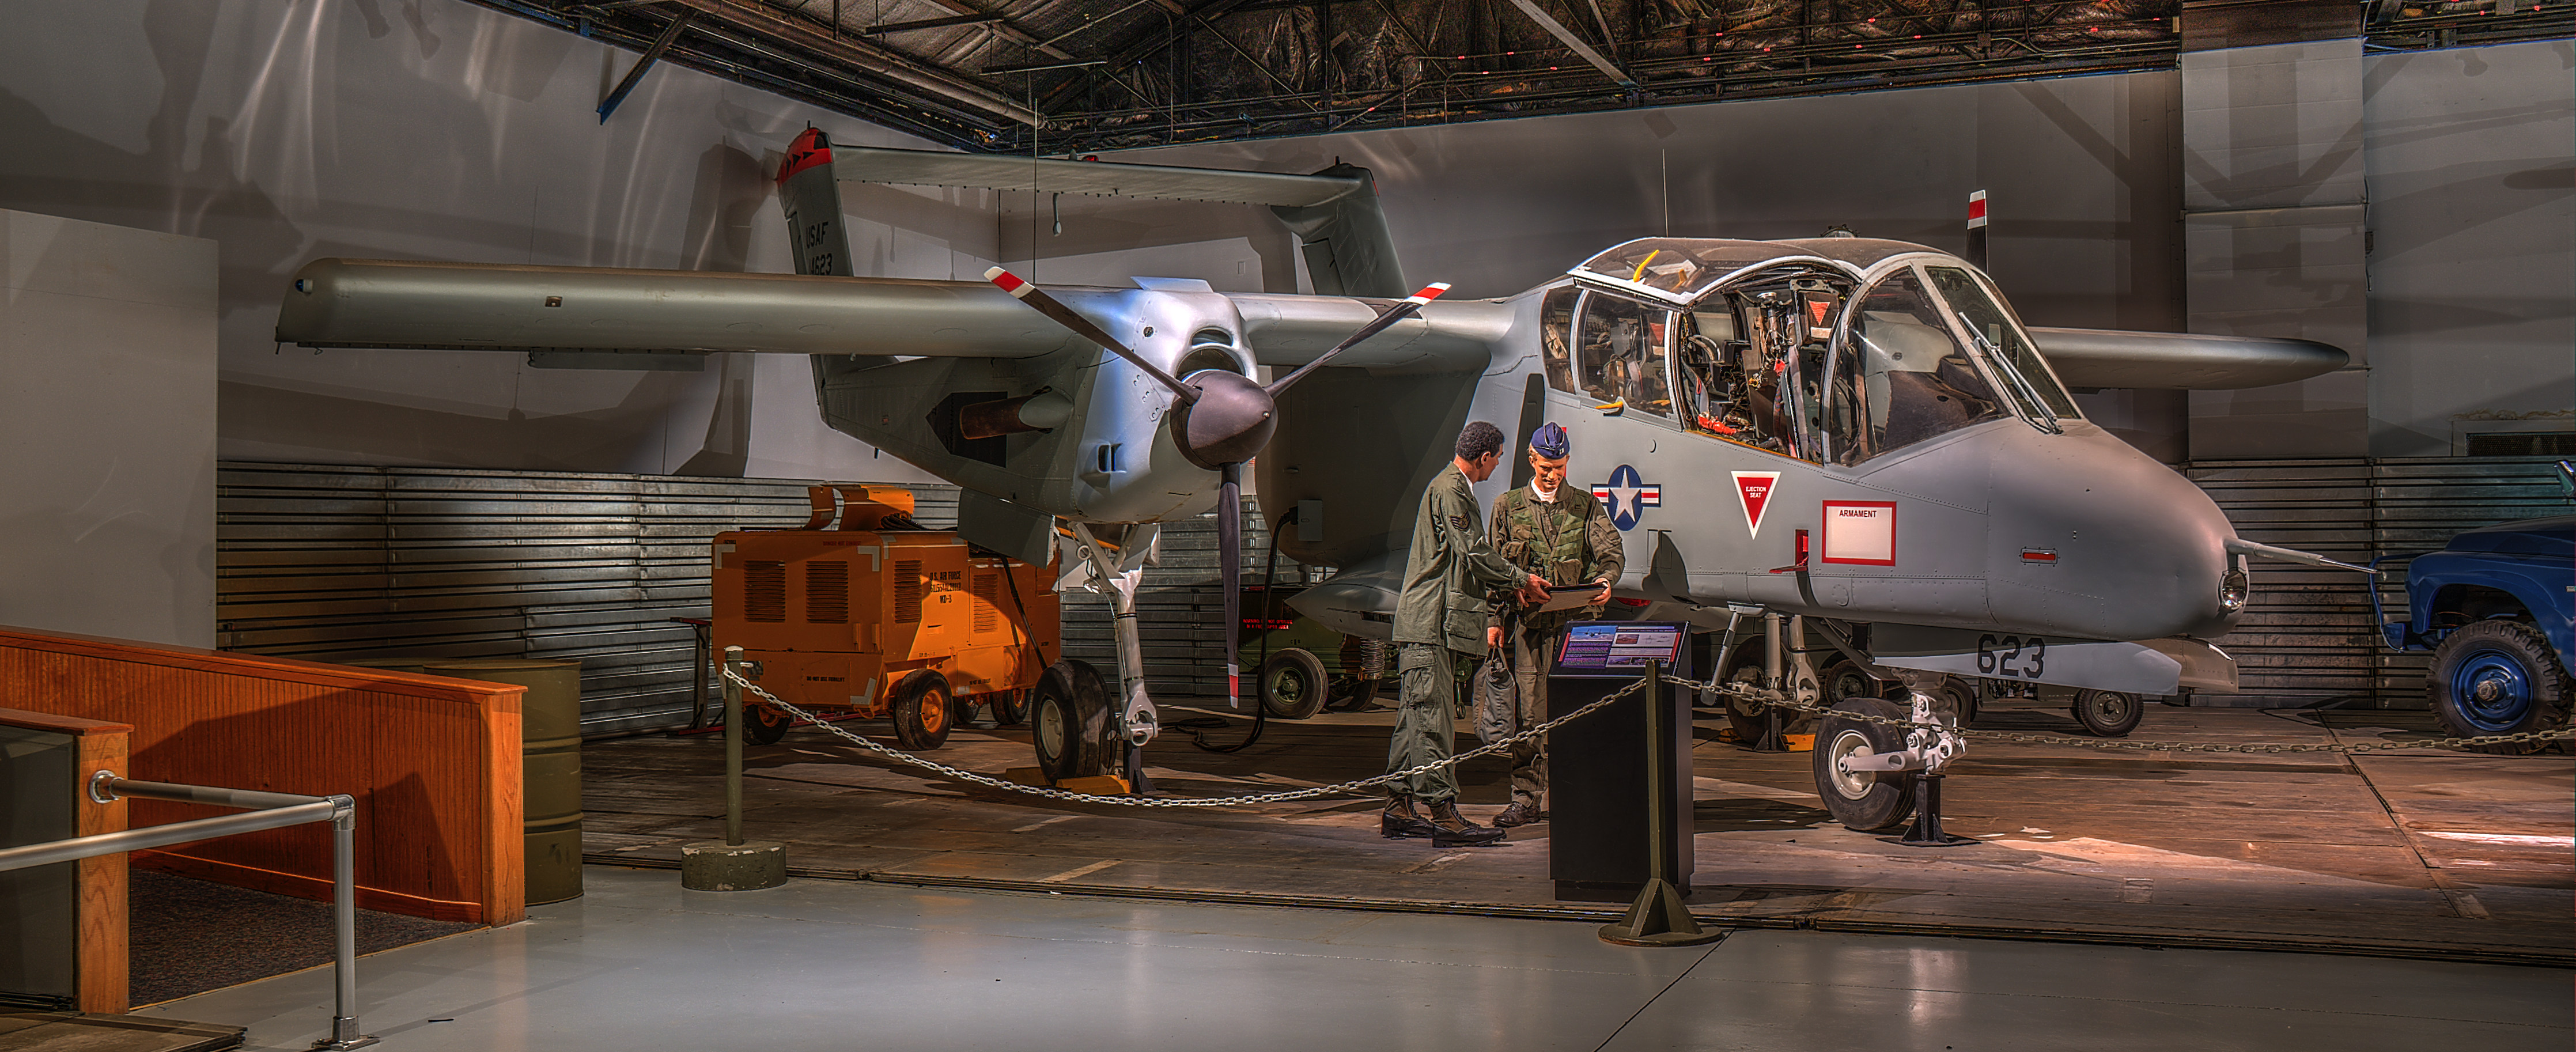
| 5 | OV-10 Bronco | 2,300 | 3,130 | 500 | 3,630 | 6,550 | 2,920 | 954 | 100 | 450 | 7 | 1 | -1 | 2 | -1 | 1 | -1 | -1 | 0 | -1 | 1 | 0 | 360 | 11m | 1965 | 1986 | 21 | North American Rockwell | USA | COIN |
| 6 | Average Harrier | 3,396 | 6,138 | 3,438 | 9,576 | 10,335 | 759 | 3,520 | 20 | 850 | 6 | -1 | 1 | -1 | -1 | 1 | 1 | -1 | 1 | -1 | -4 | -5 | 869 | 21m | 1967 | 2011 | 44 | Various | Britain, USA | |
| 7 | SU-24 Fencer | 2,775 | 22,300 | 8,000 | 30,300 | 43,755 | 13,455 | 10,700 | 100 | 1,310 | 8 | 1 | -2 | -1 | 1 | 1 | 1 | 1 | 1 | 0 | 1 | 4 | 1,400 | 25m | 1967 | 1993 | 26 | Sukhoi | Russia | SUPERSONIC |
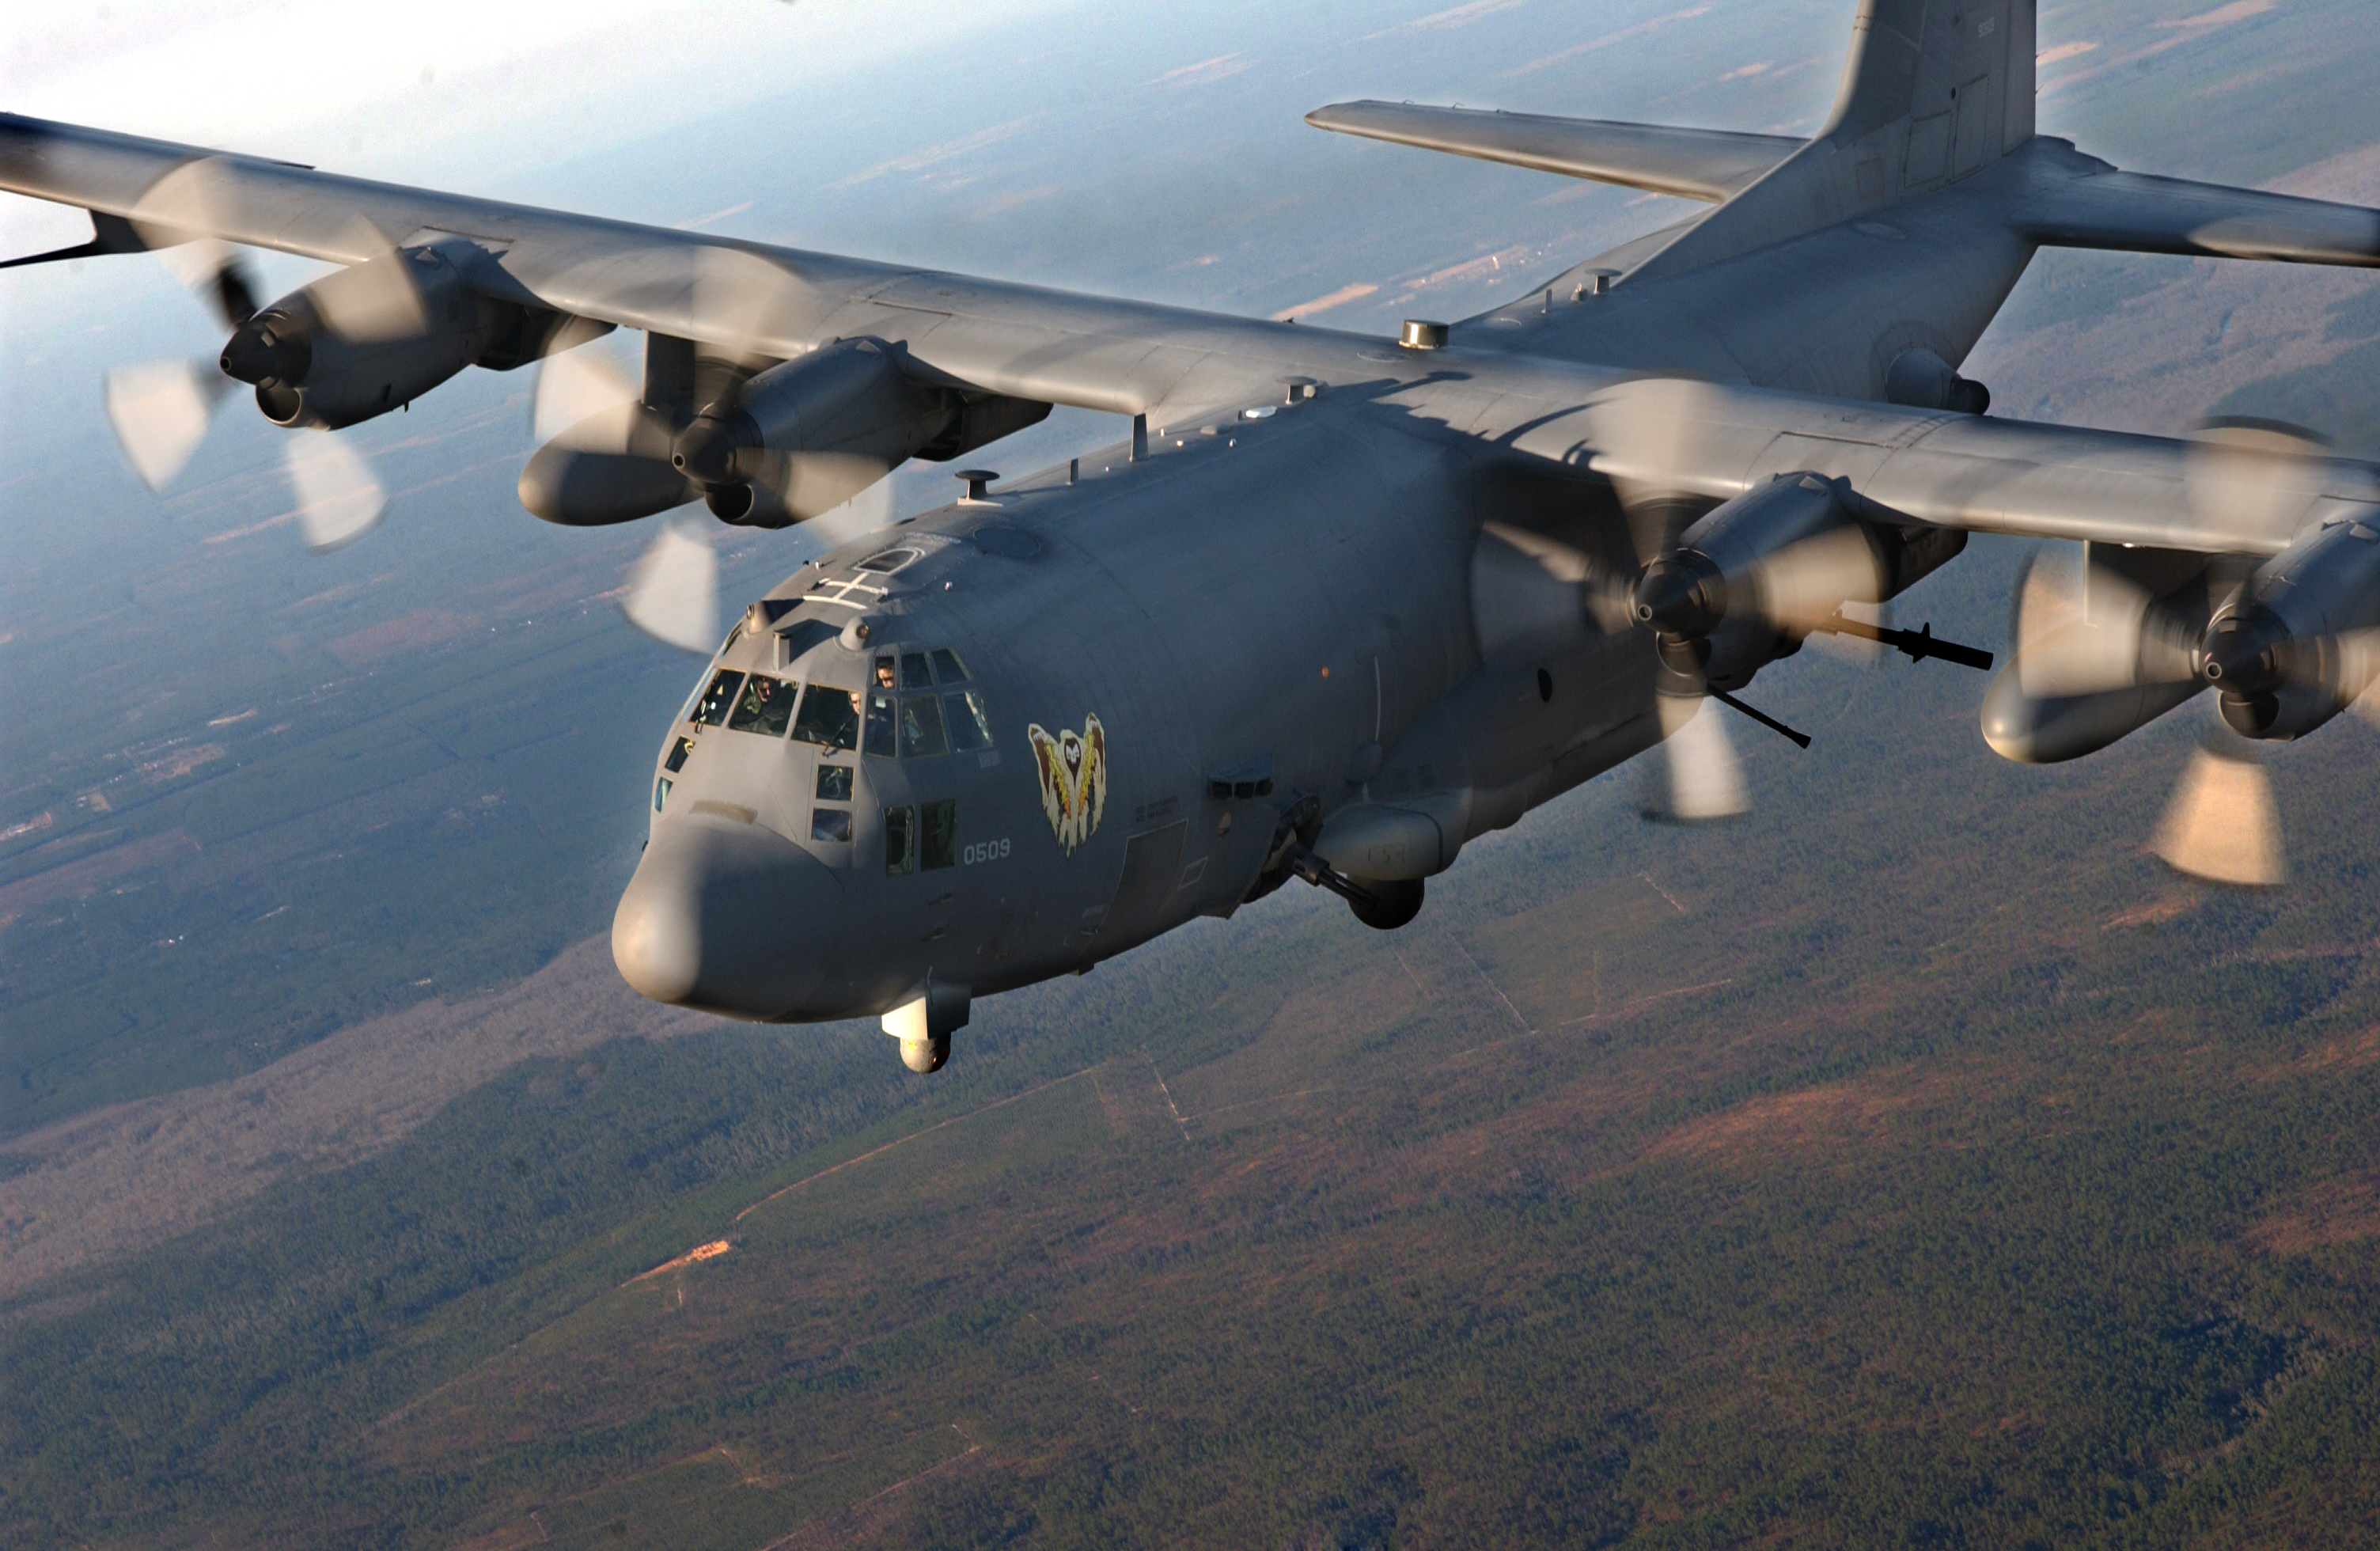
| 8 | AC-130 | 5,000 | 33,000 | 22,520 | 55,520 | 69,750 | 14,230 | 20,820 | 68 | 520 | 4 | 1 | 1 | 2 | -1 | 1 | 1 | -1 | 1 | 1 | -2 | 4 | 47 | 150m | 1968 | 2017 | 49 | Lockheed, Boeing | USA | CAS |
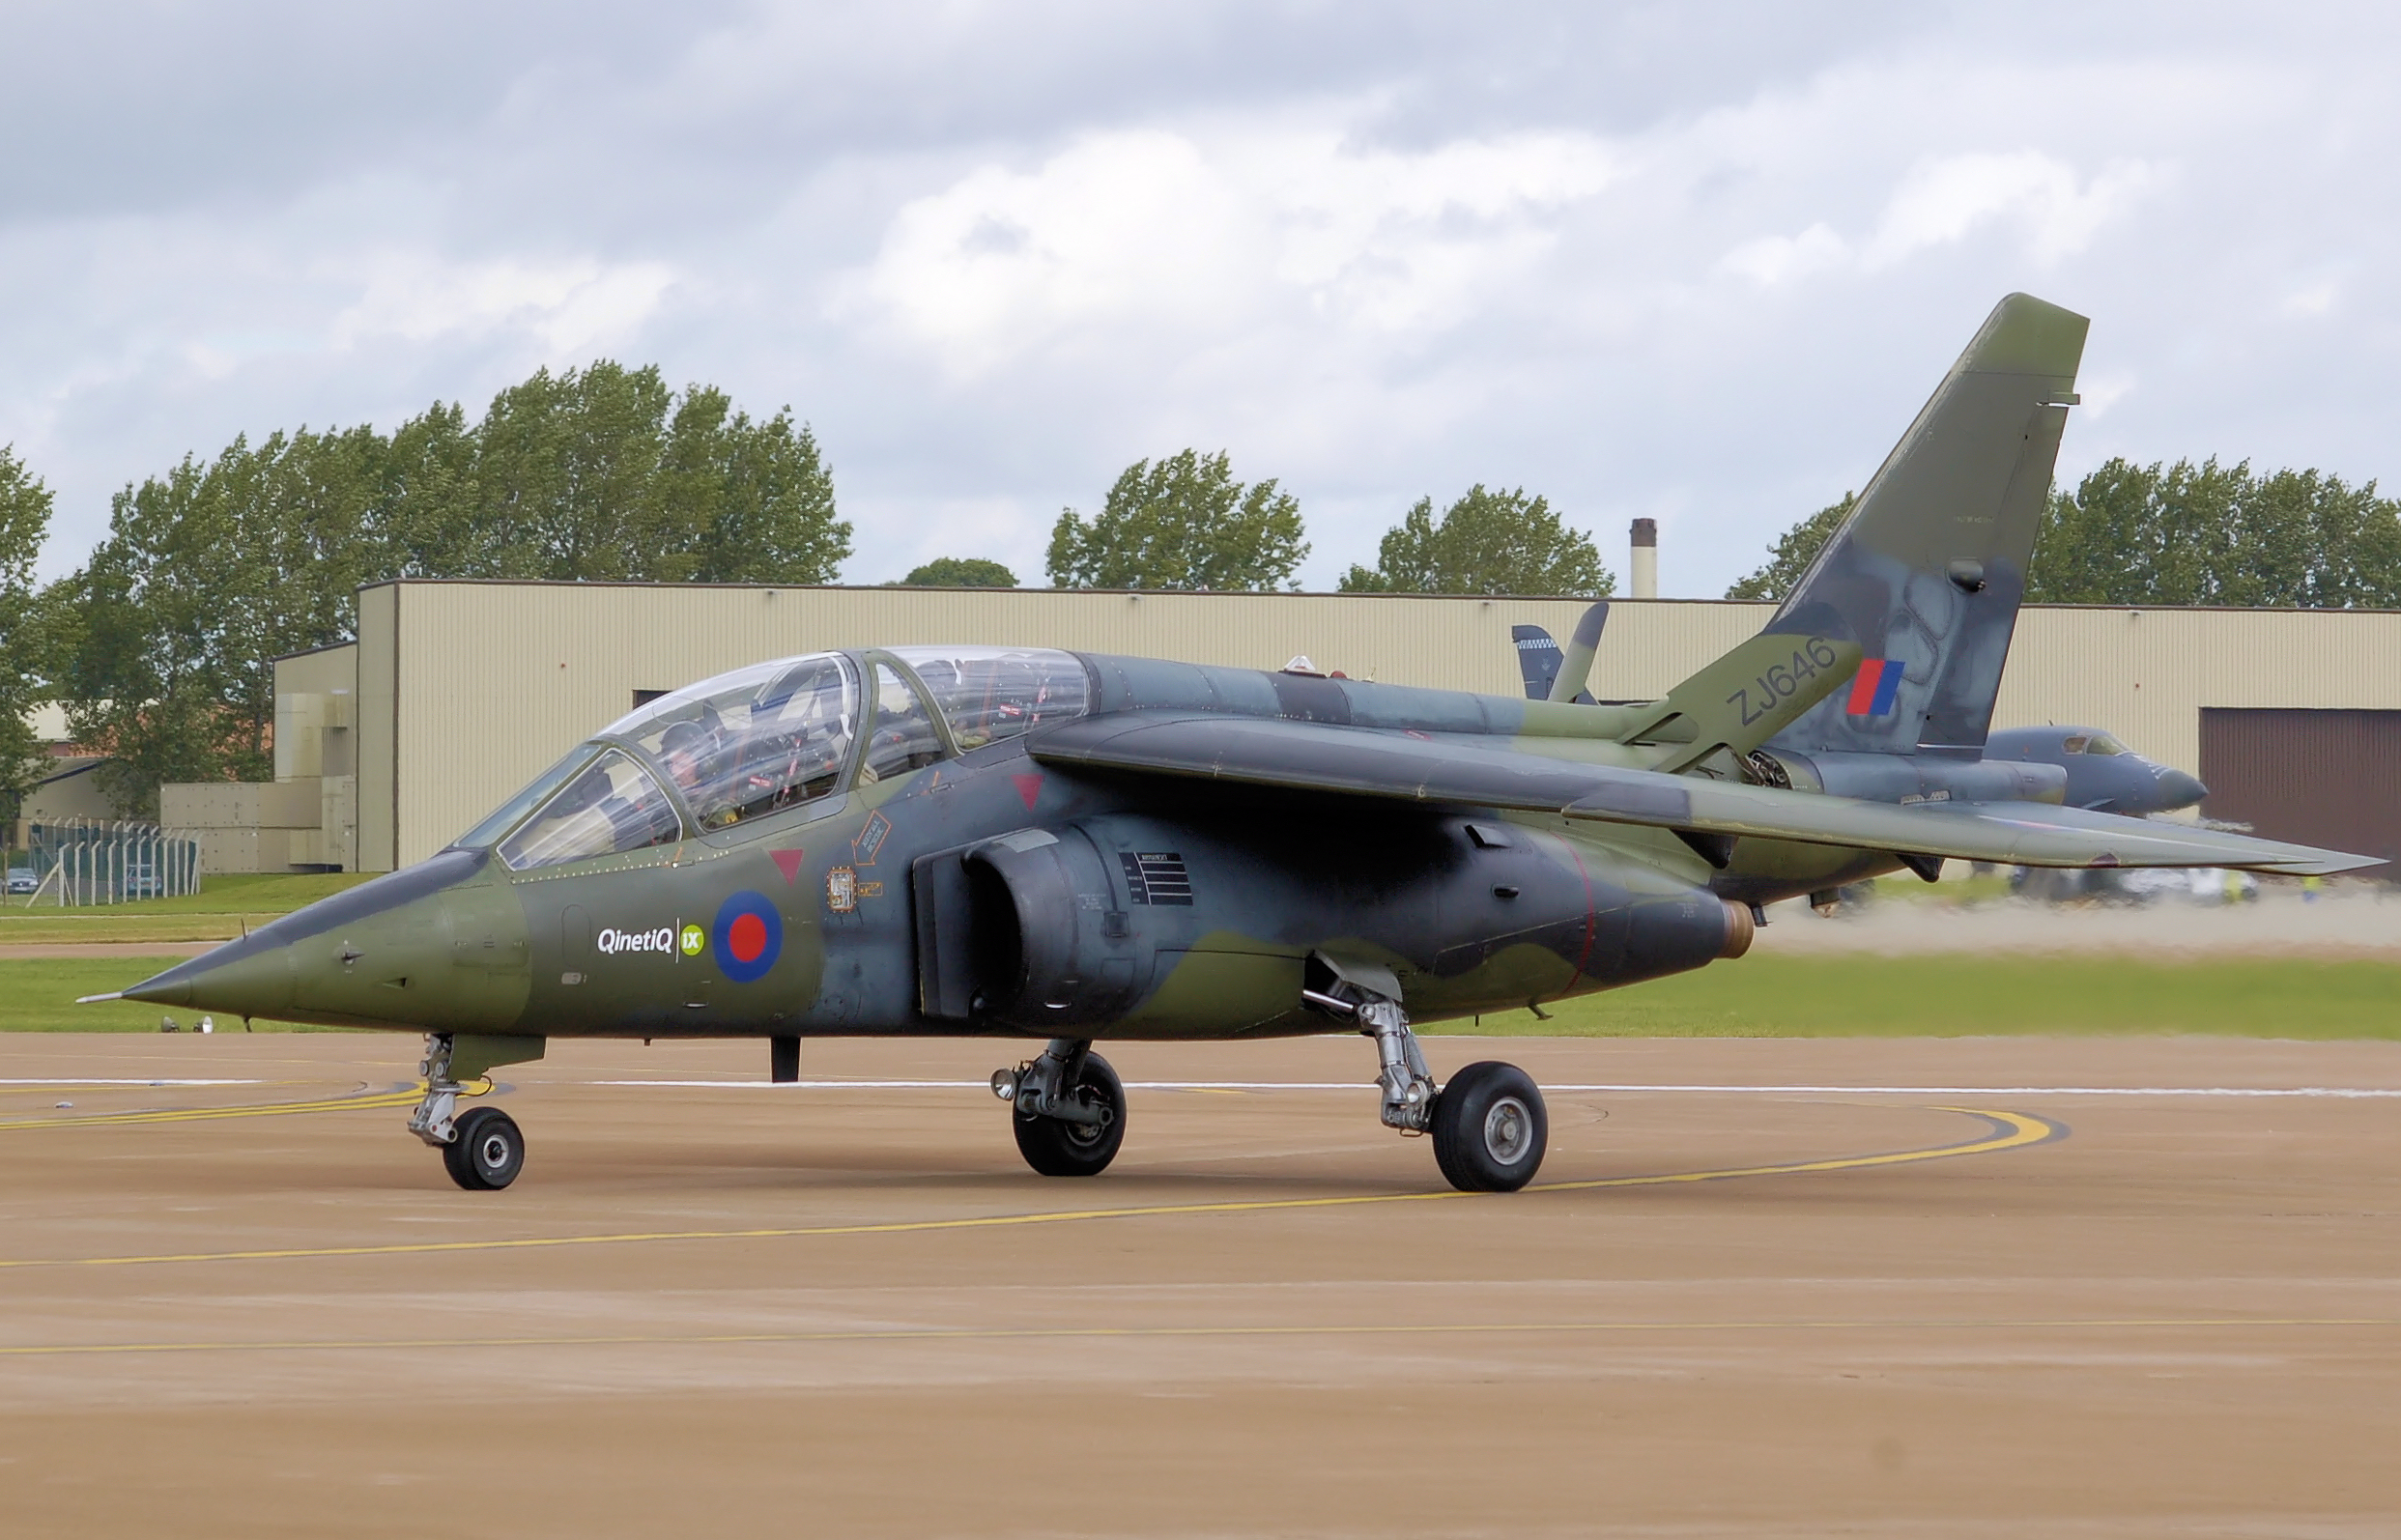
| 9 | SEPECAT Jaguar | 3,520 | 7,000 | 4,500 | 11,500 | 15,700 | 4,200 | 3,340 | 100 | 1,590 | 5 | 1 | 1 | 2 | 1 | 1 | 1 | 1 | 1 | 0 | 1 | 9 | 543 | 8m | 1968 | 1981 | 13 | PANAVIA | Britain, Germany, Italy | SUPERSONIC |
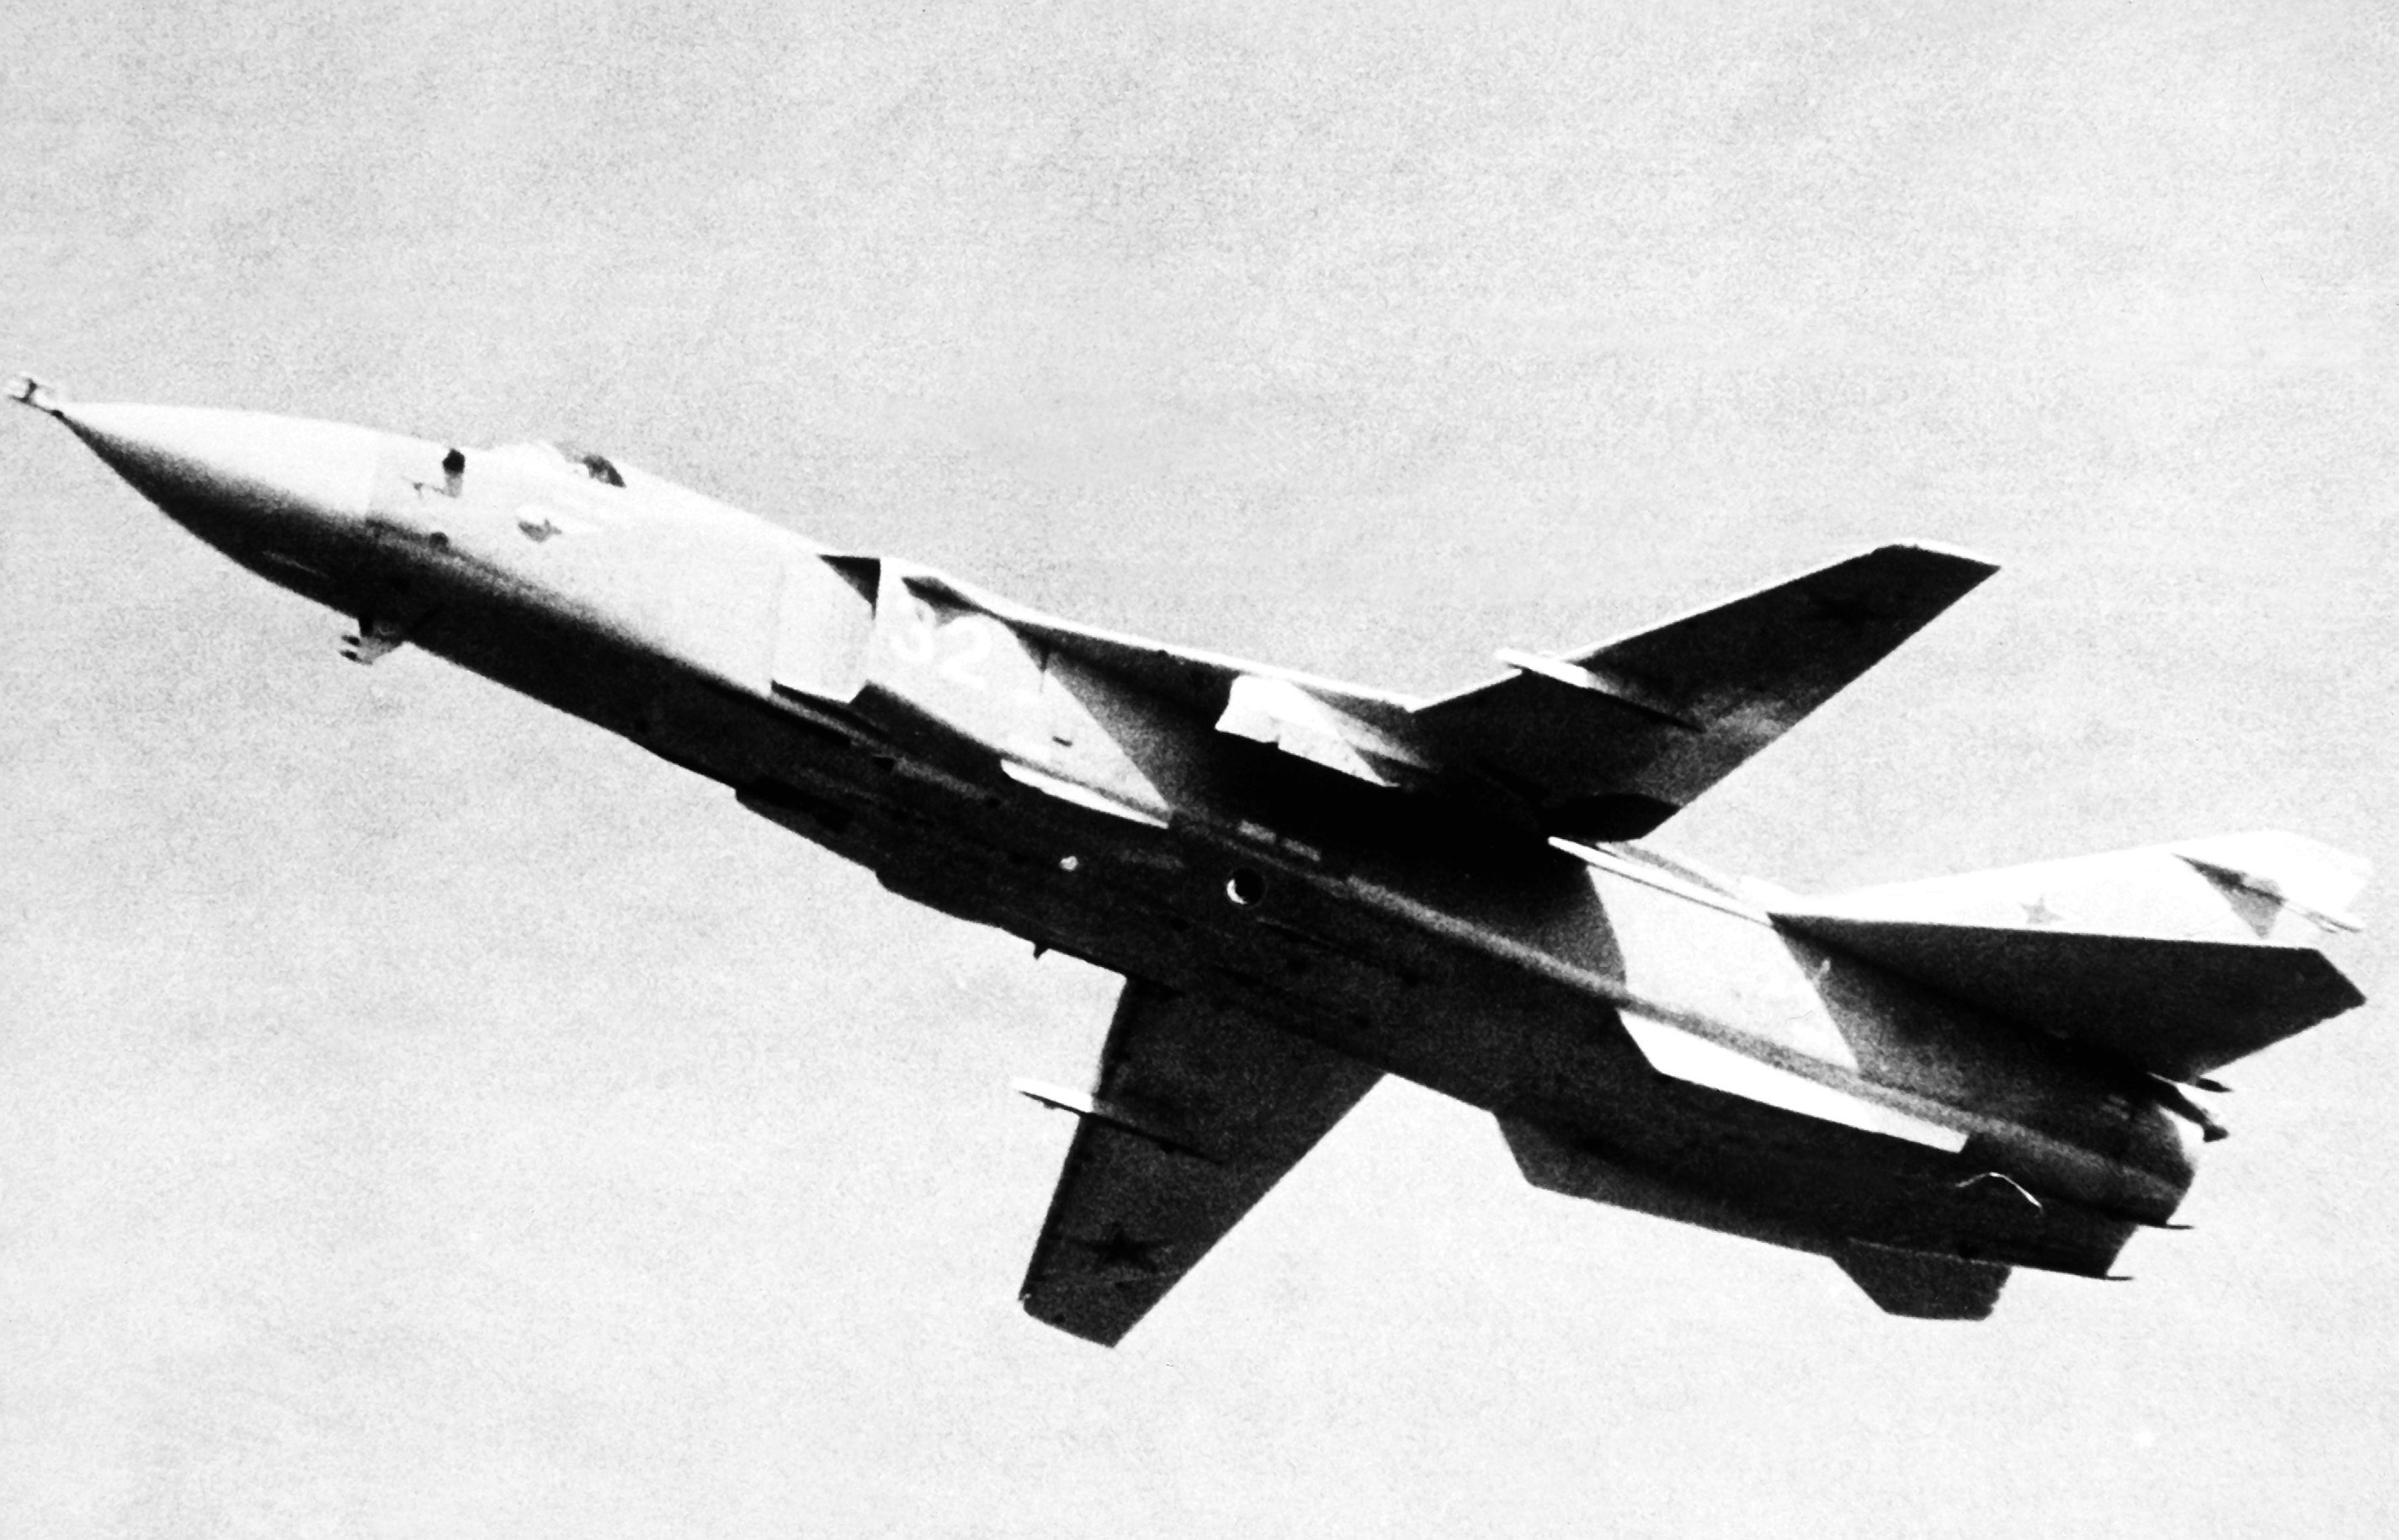
| 10 | MiG-27 Flogger | 2,500 | 11,910 | 4,000 | 15,910 | 20,670 | 4,760 | 4,500 | 100 | 1,400 | 7 | -1 | -2 | 1 | 1 | -1 | 1 | 1 | -2 | 0 | 1 | -1 | 1,075 | 15m | 1970 | 1986 | 16 | Mikoyan and Gurevich | Russia | SUPERSONIC |
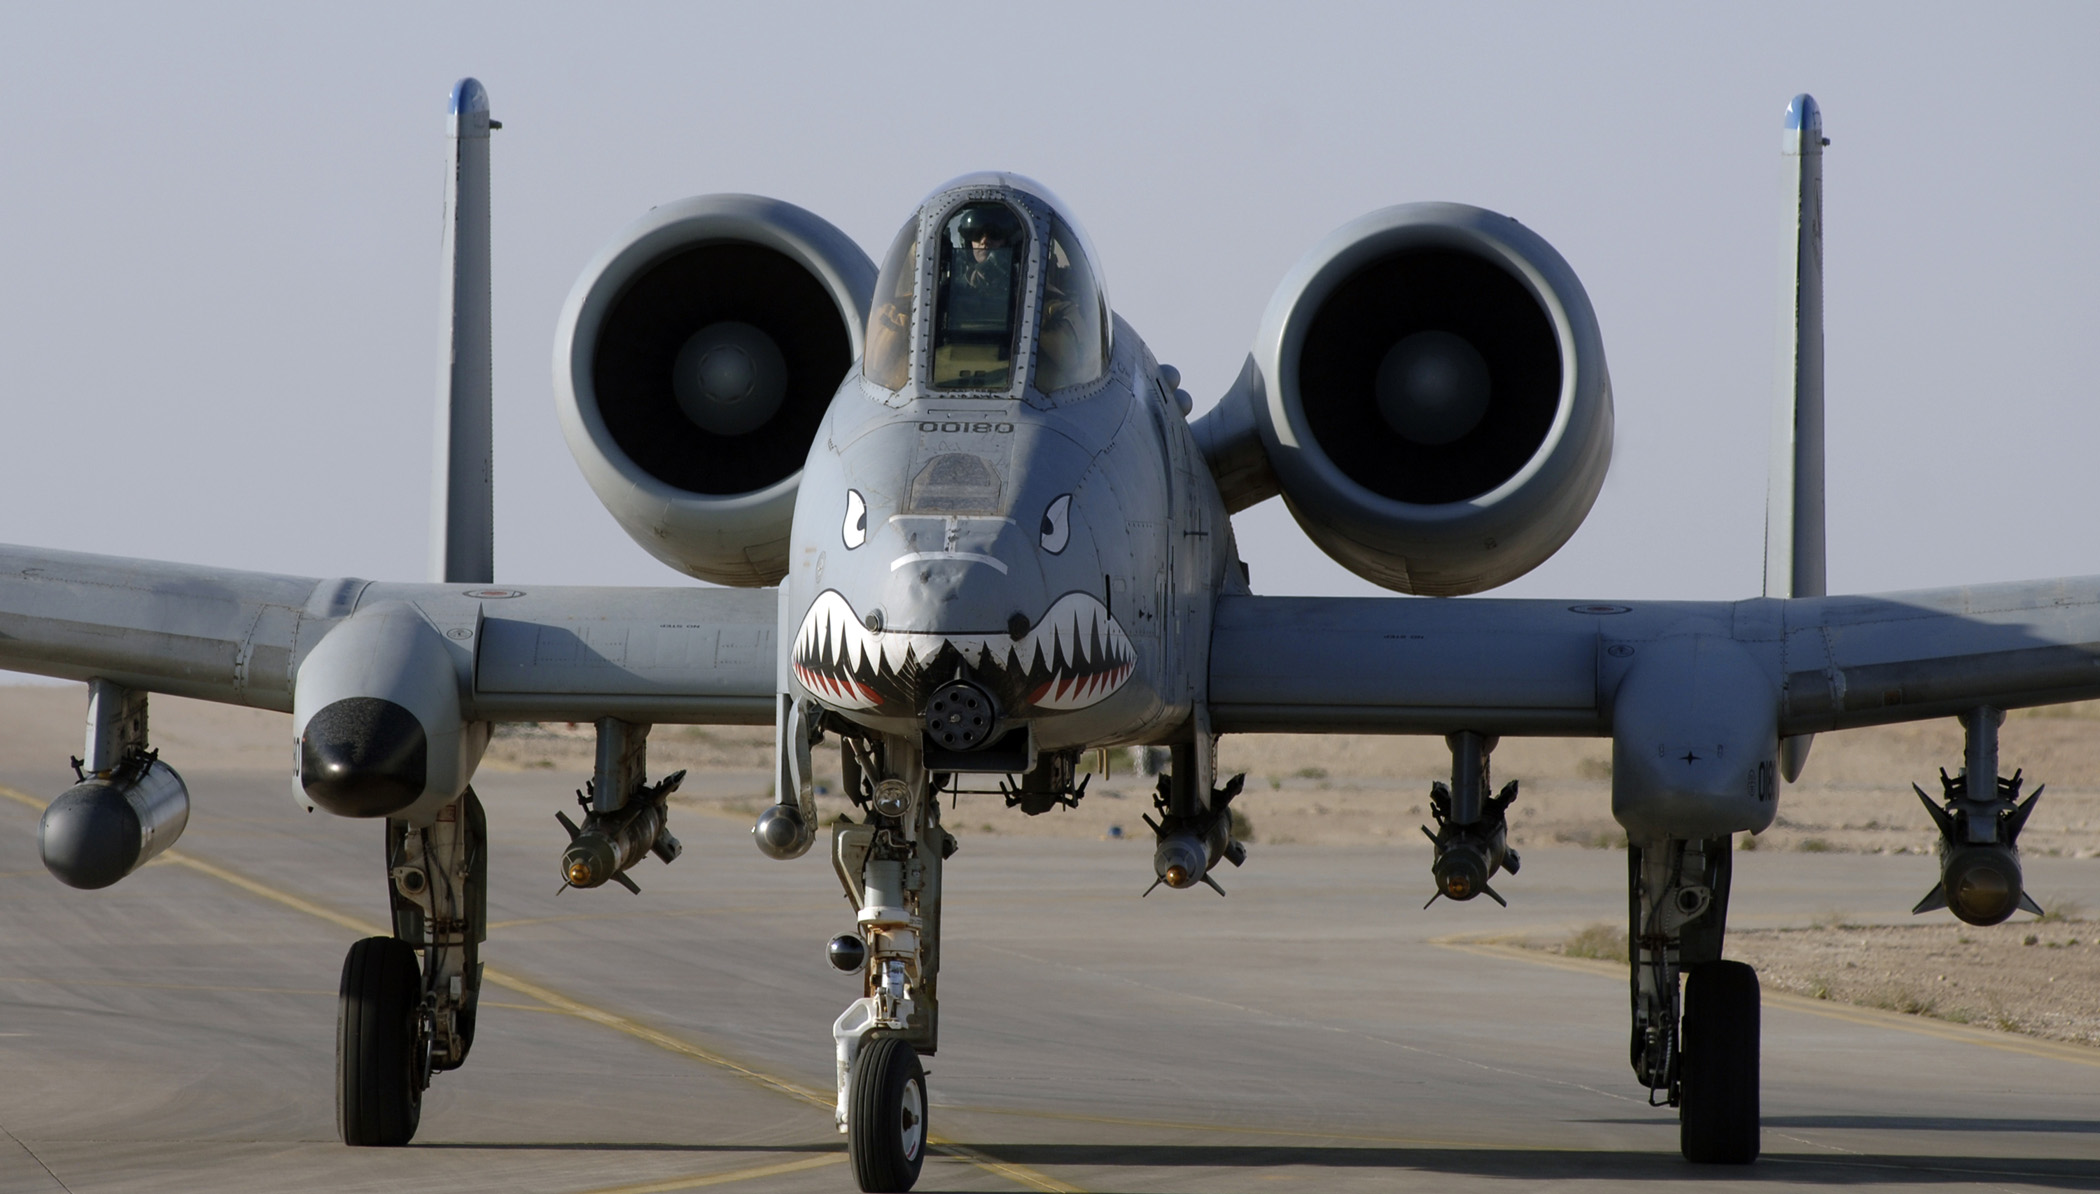
| 11 | A-10 Warthog | 4,150 | 11,320 | 7,260 | 18,580 | 23,000 | 4,420 | 4,990 | 89 | 560 | 11 | 1 | -1 | -1 | -1 | -1 | -1 | -1 | 1 | 1 | 1 | -2 | 716 | 18.8m | 1972 | 1984 | 12 | Fairchild Republic | USA | CAS |
| 12 | Alphajet | 2,940 | 3,510 | 2,500 | 6,010 | 7,500 | 1,490 | 2,040 | 73 | 890 | 5 | -1 | 1 | -1 | -1 | -1 | -1 | -1 | -1 | -1 | -2 | -9 | 480 | 4.5m | 1973 | 1991 | 18 | Dassault, Dornier | Germany, France | trainer, light attack |
| 13 | BAE Hawk | 3,100 | 4,480 | 3,090 | 7,570 | 9,100 | 1,530 | 1,260 | 100 | 1,040 | 5 | -1 | -1 | -1 | -1 | -1 | -1 | -1 | -1 | -1 | 1 | -8 | 1000+ | 22.5m | 1974 | 2017 | 43 | British Aerospace, BAE Systems | Britain | trainer |
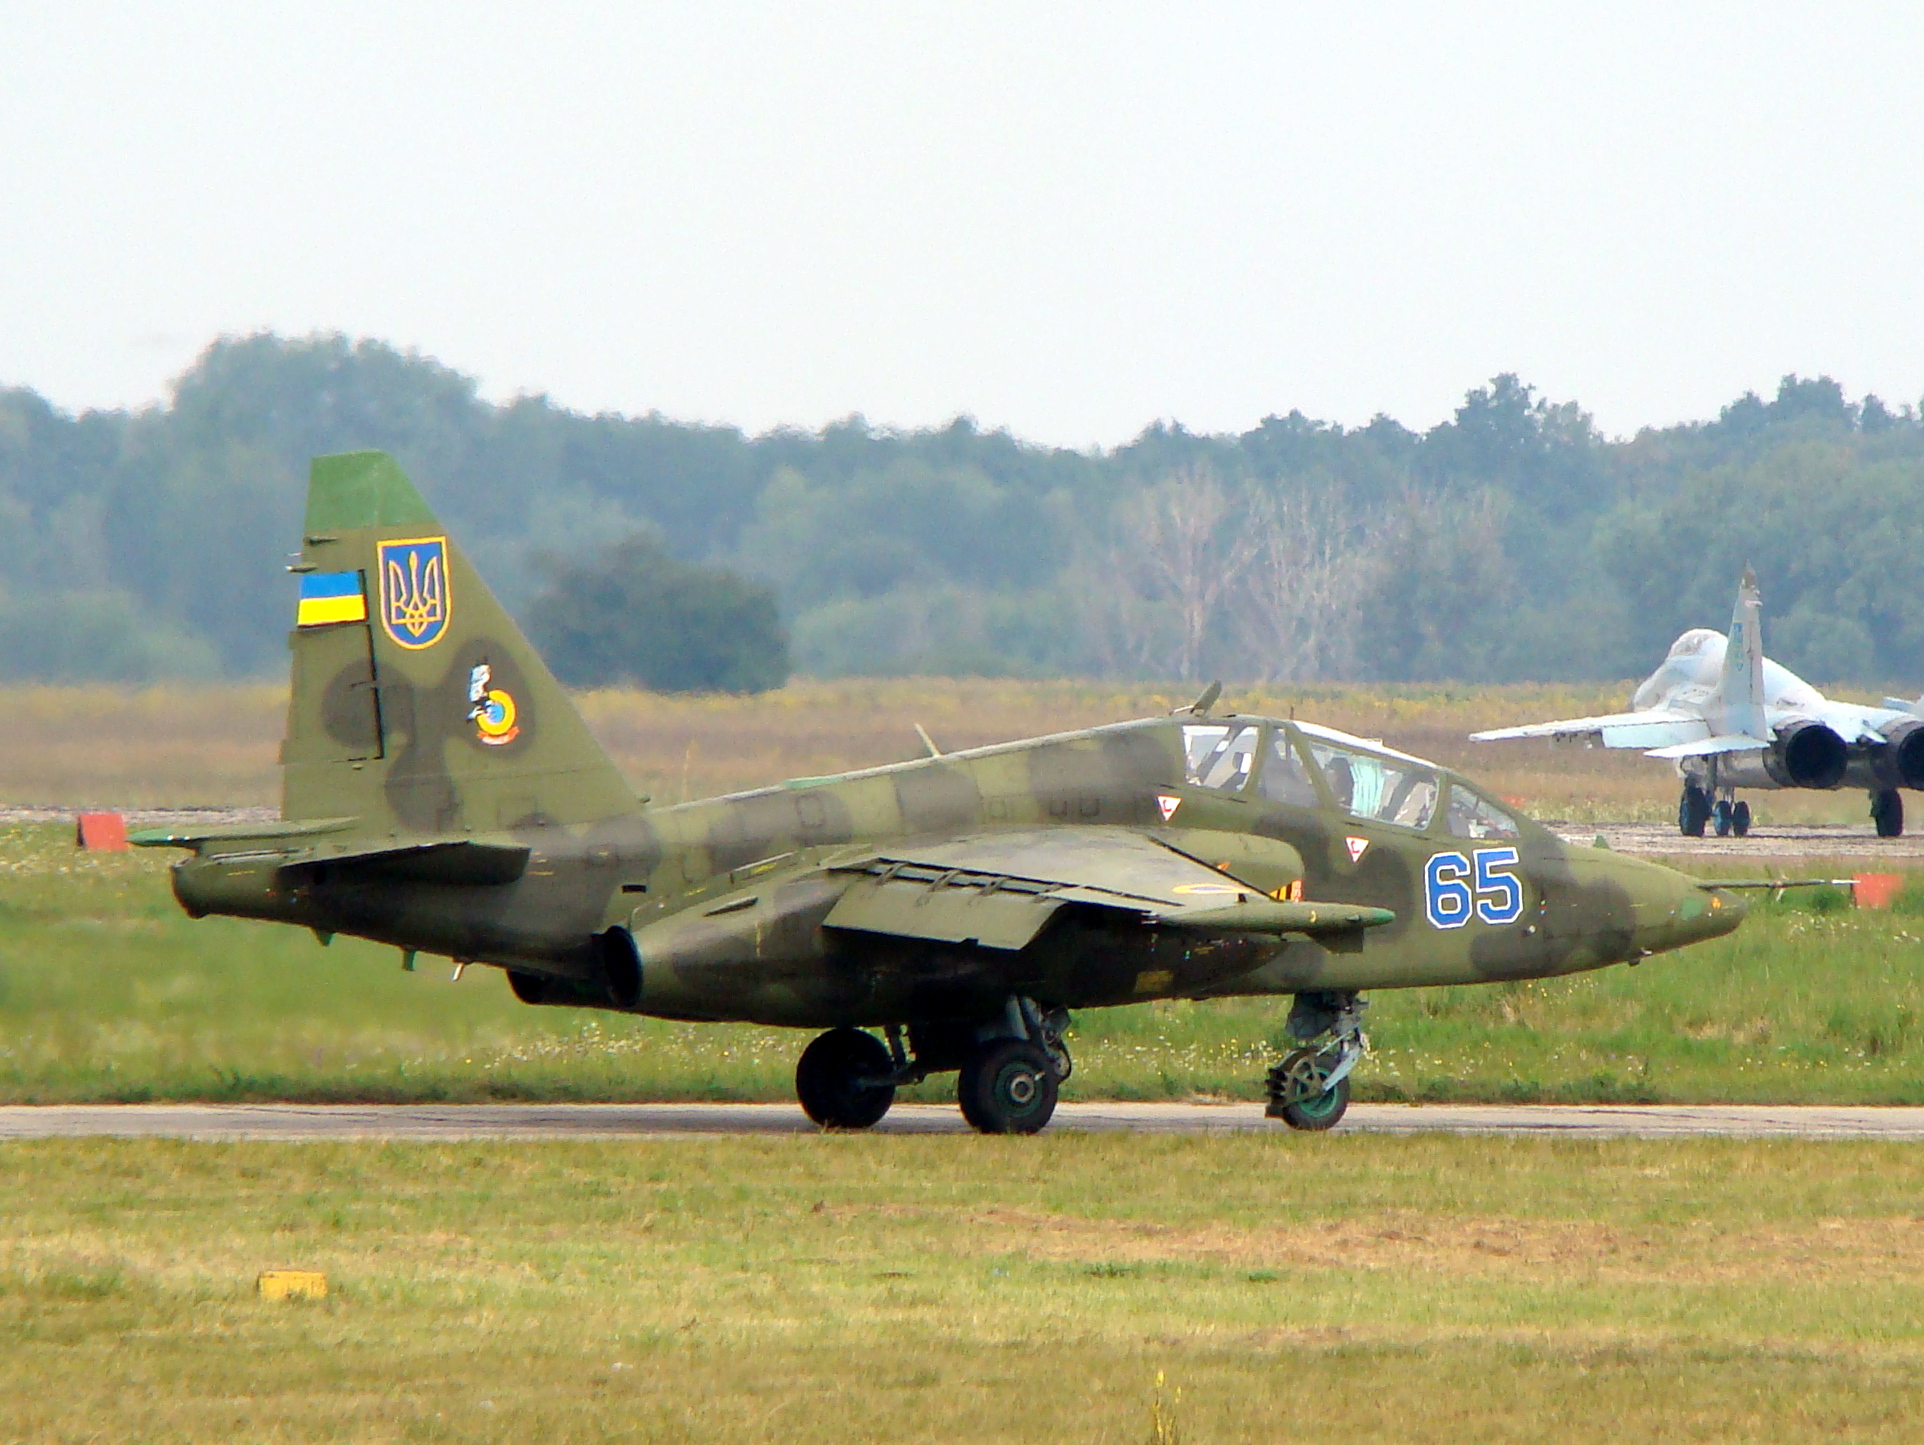
| 14 | SU-25 Frogfoot | 2,250 | 9,800 | 4,000 | 13,800 | 19,300 | 5,500 | 3,600 | 100 | 650 | 11 | 1 | -1 | -1 | -1 | 1 | 1 | -1 | -1 | 1 | 1 | 0 | 1000+ | 11m | 1978 | 2017 | 39 | Sukhoi | Russia | CAS |
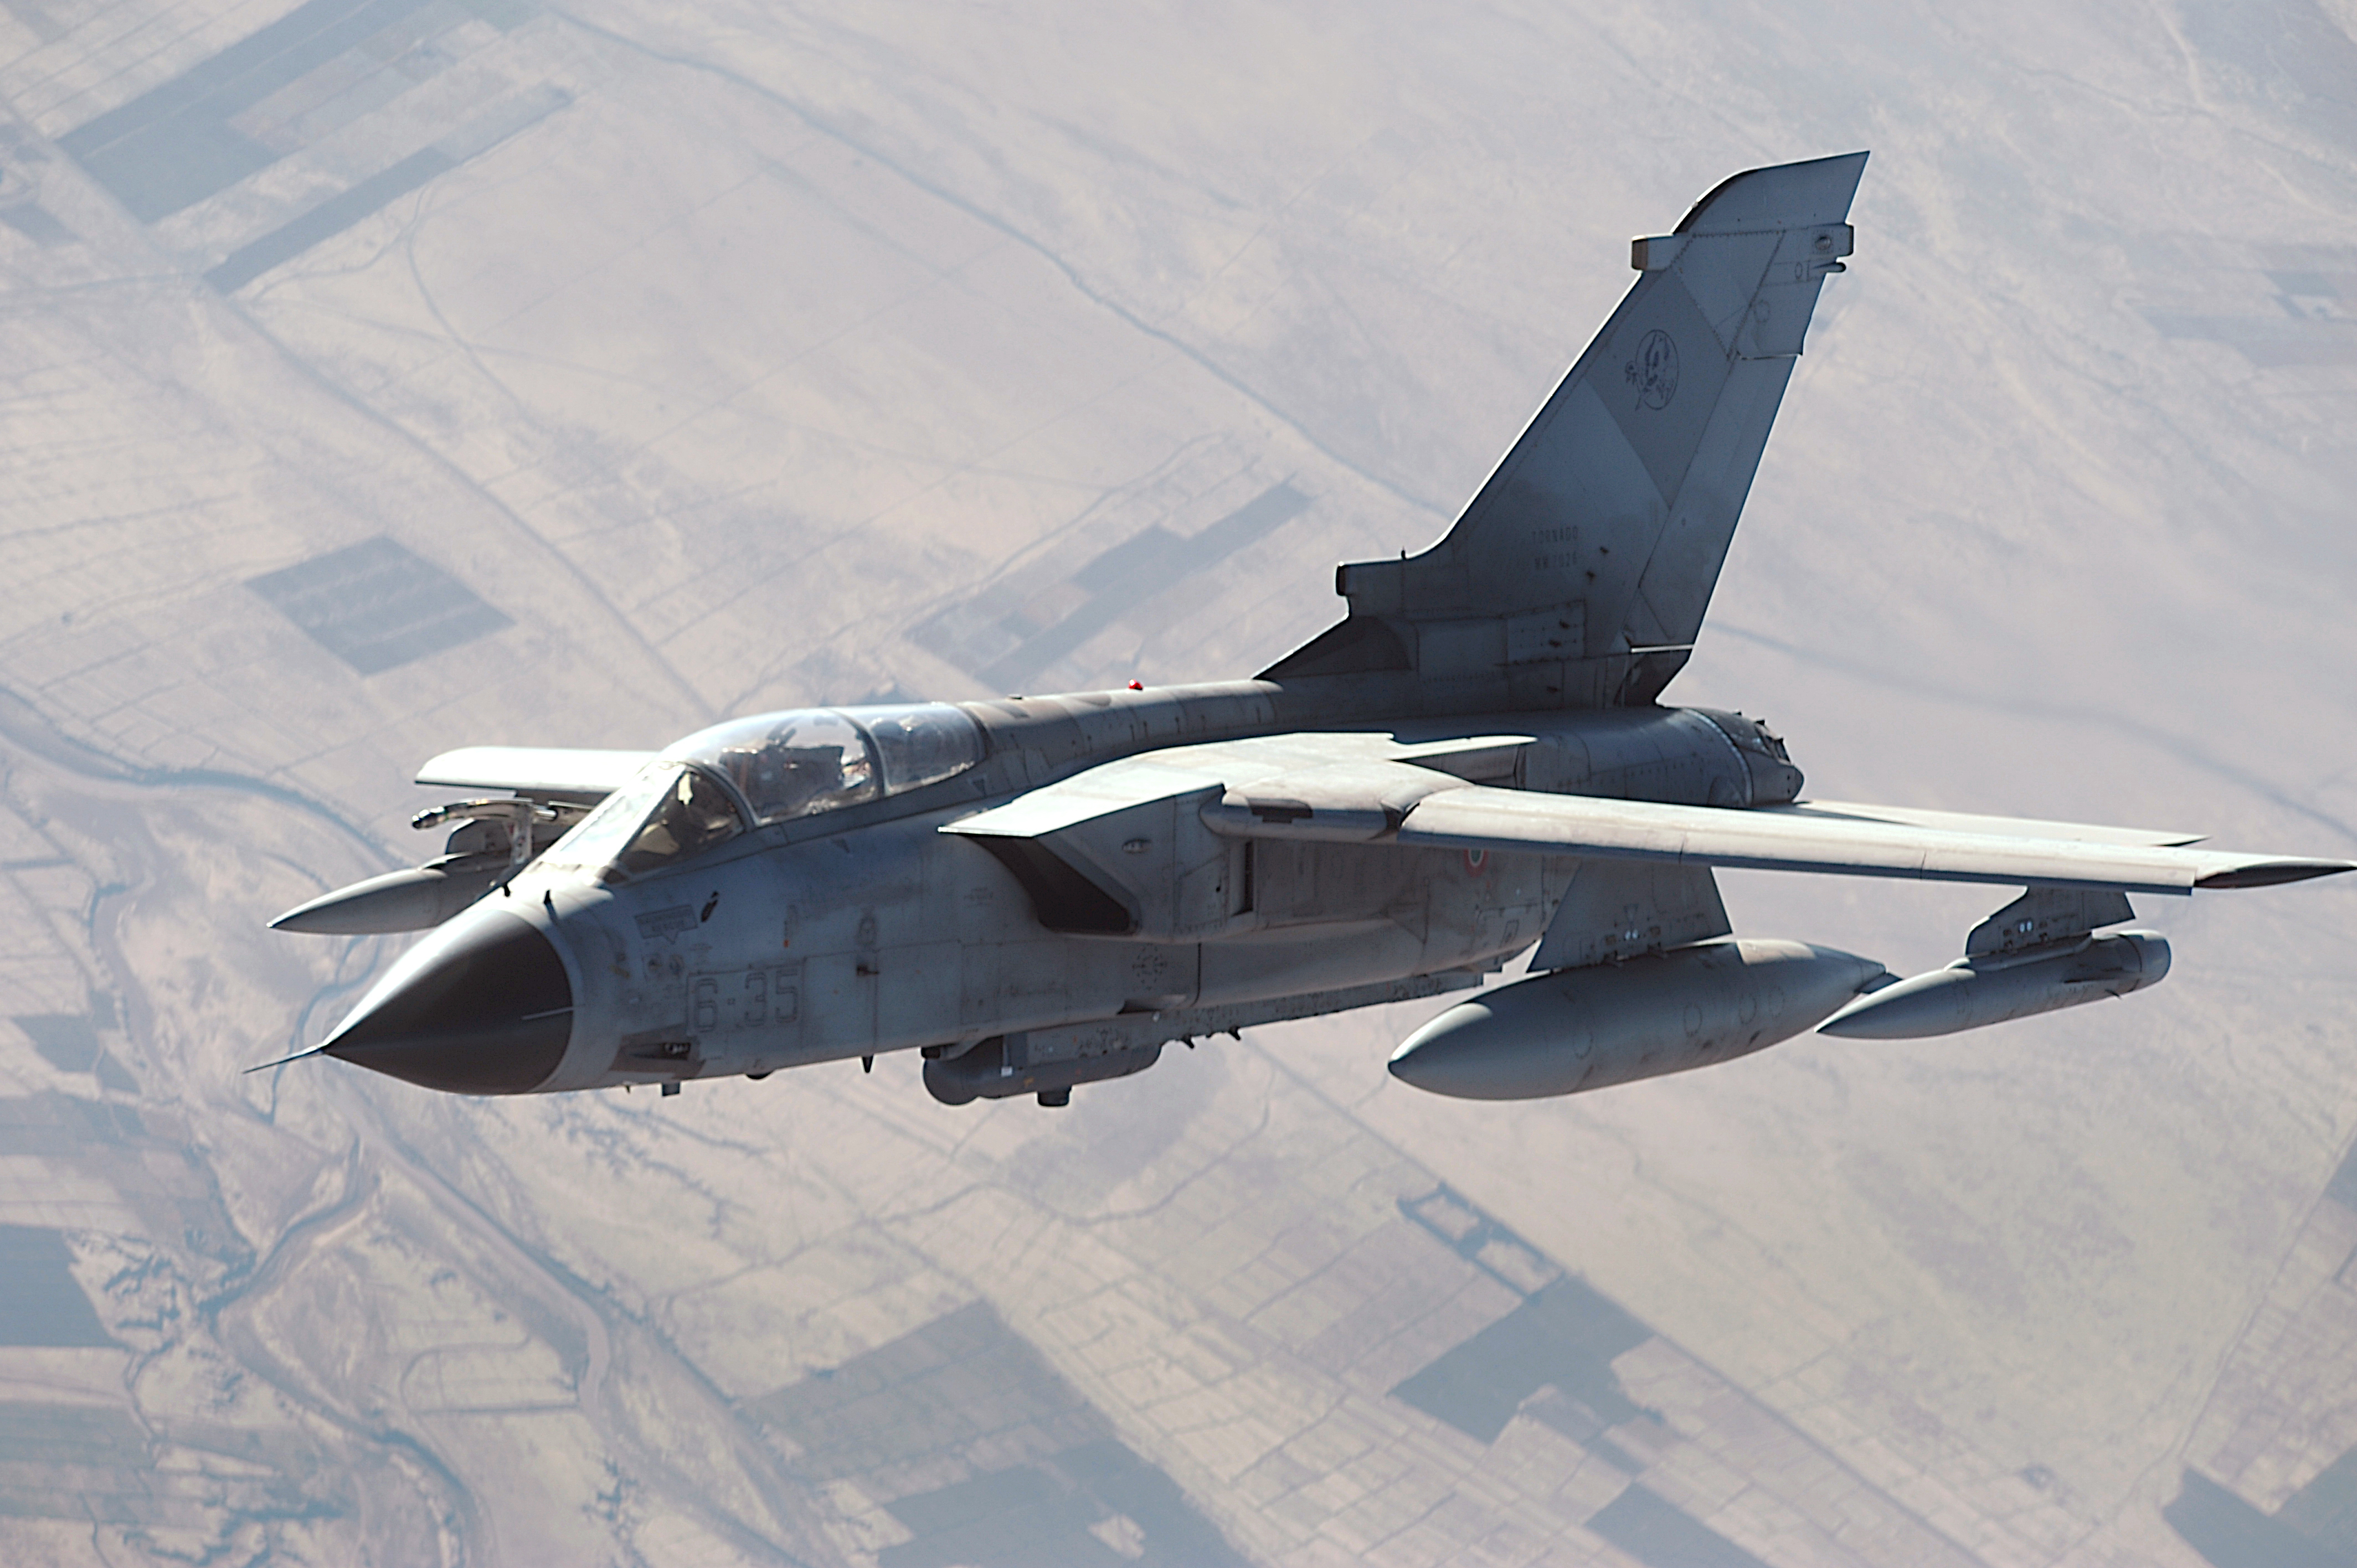
| 15 | PANAVIA Tornado | 3,890 | 13,890 | 9,000 | 22,890 | 28,000 | 5,110 | 4,650 | 100 | 1,480 | 11 | 1 | 1 | -1 | 1 | 1 | 1 | 1 | 1 | 0 | 1 | 7 | 992 | 33m | 1979 | 1998 | 19 | SEPECAT | Britain, France | SUPERSONIC |
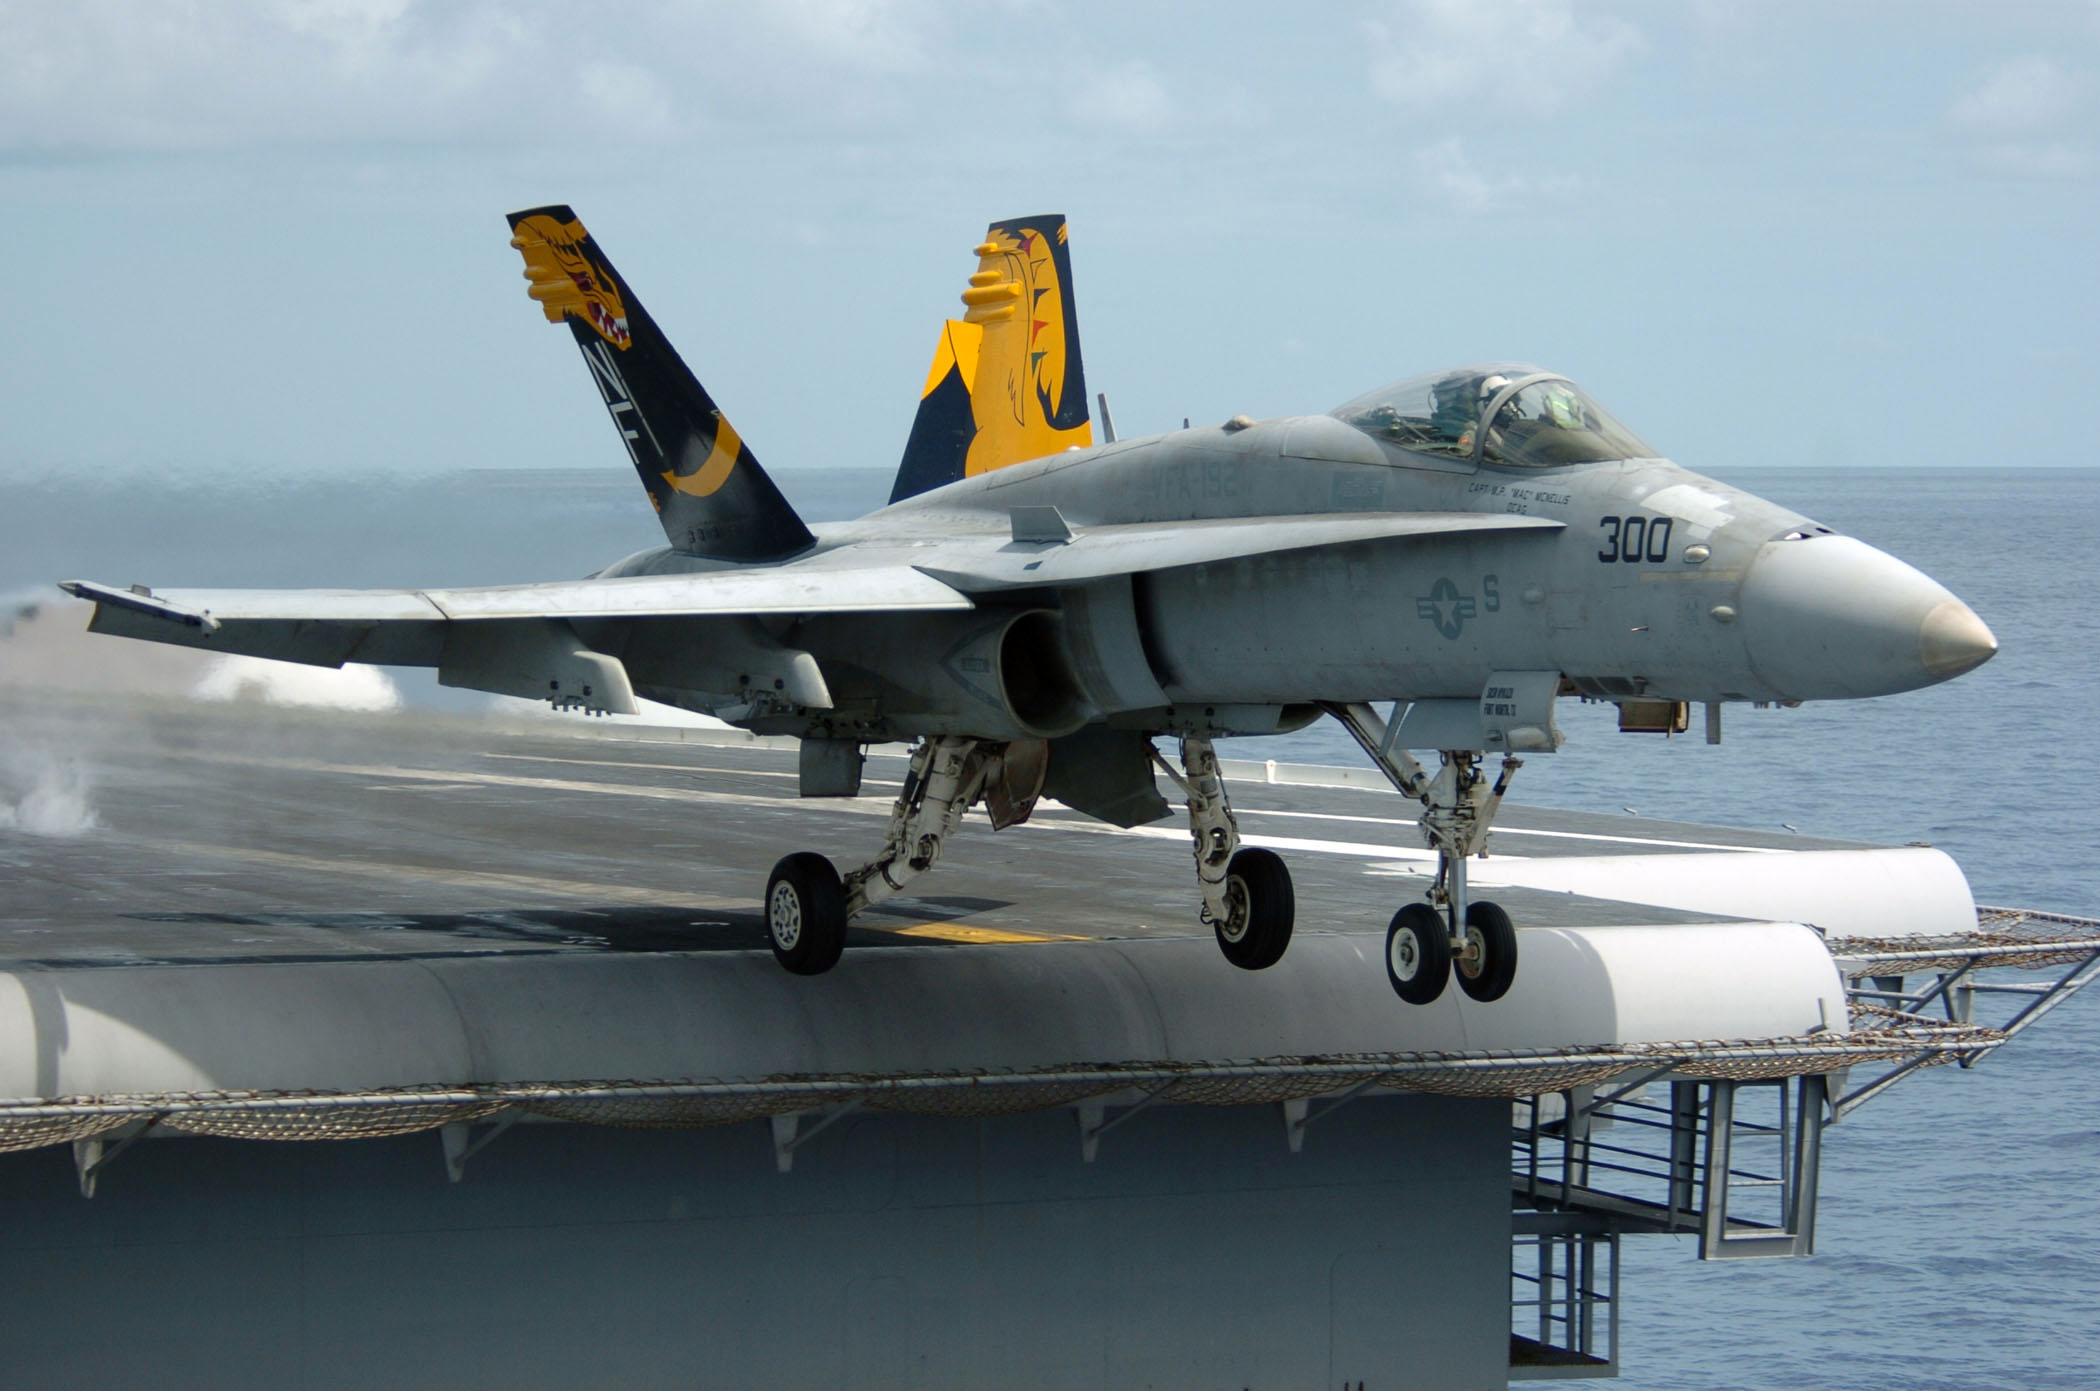
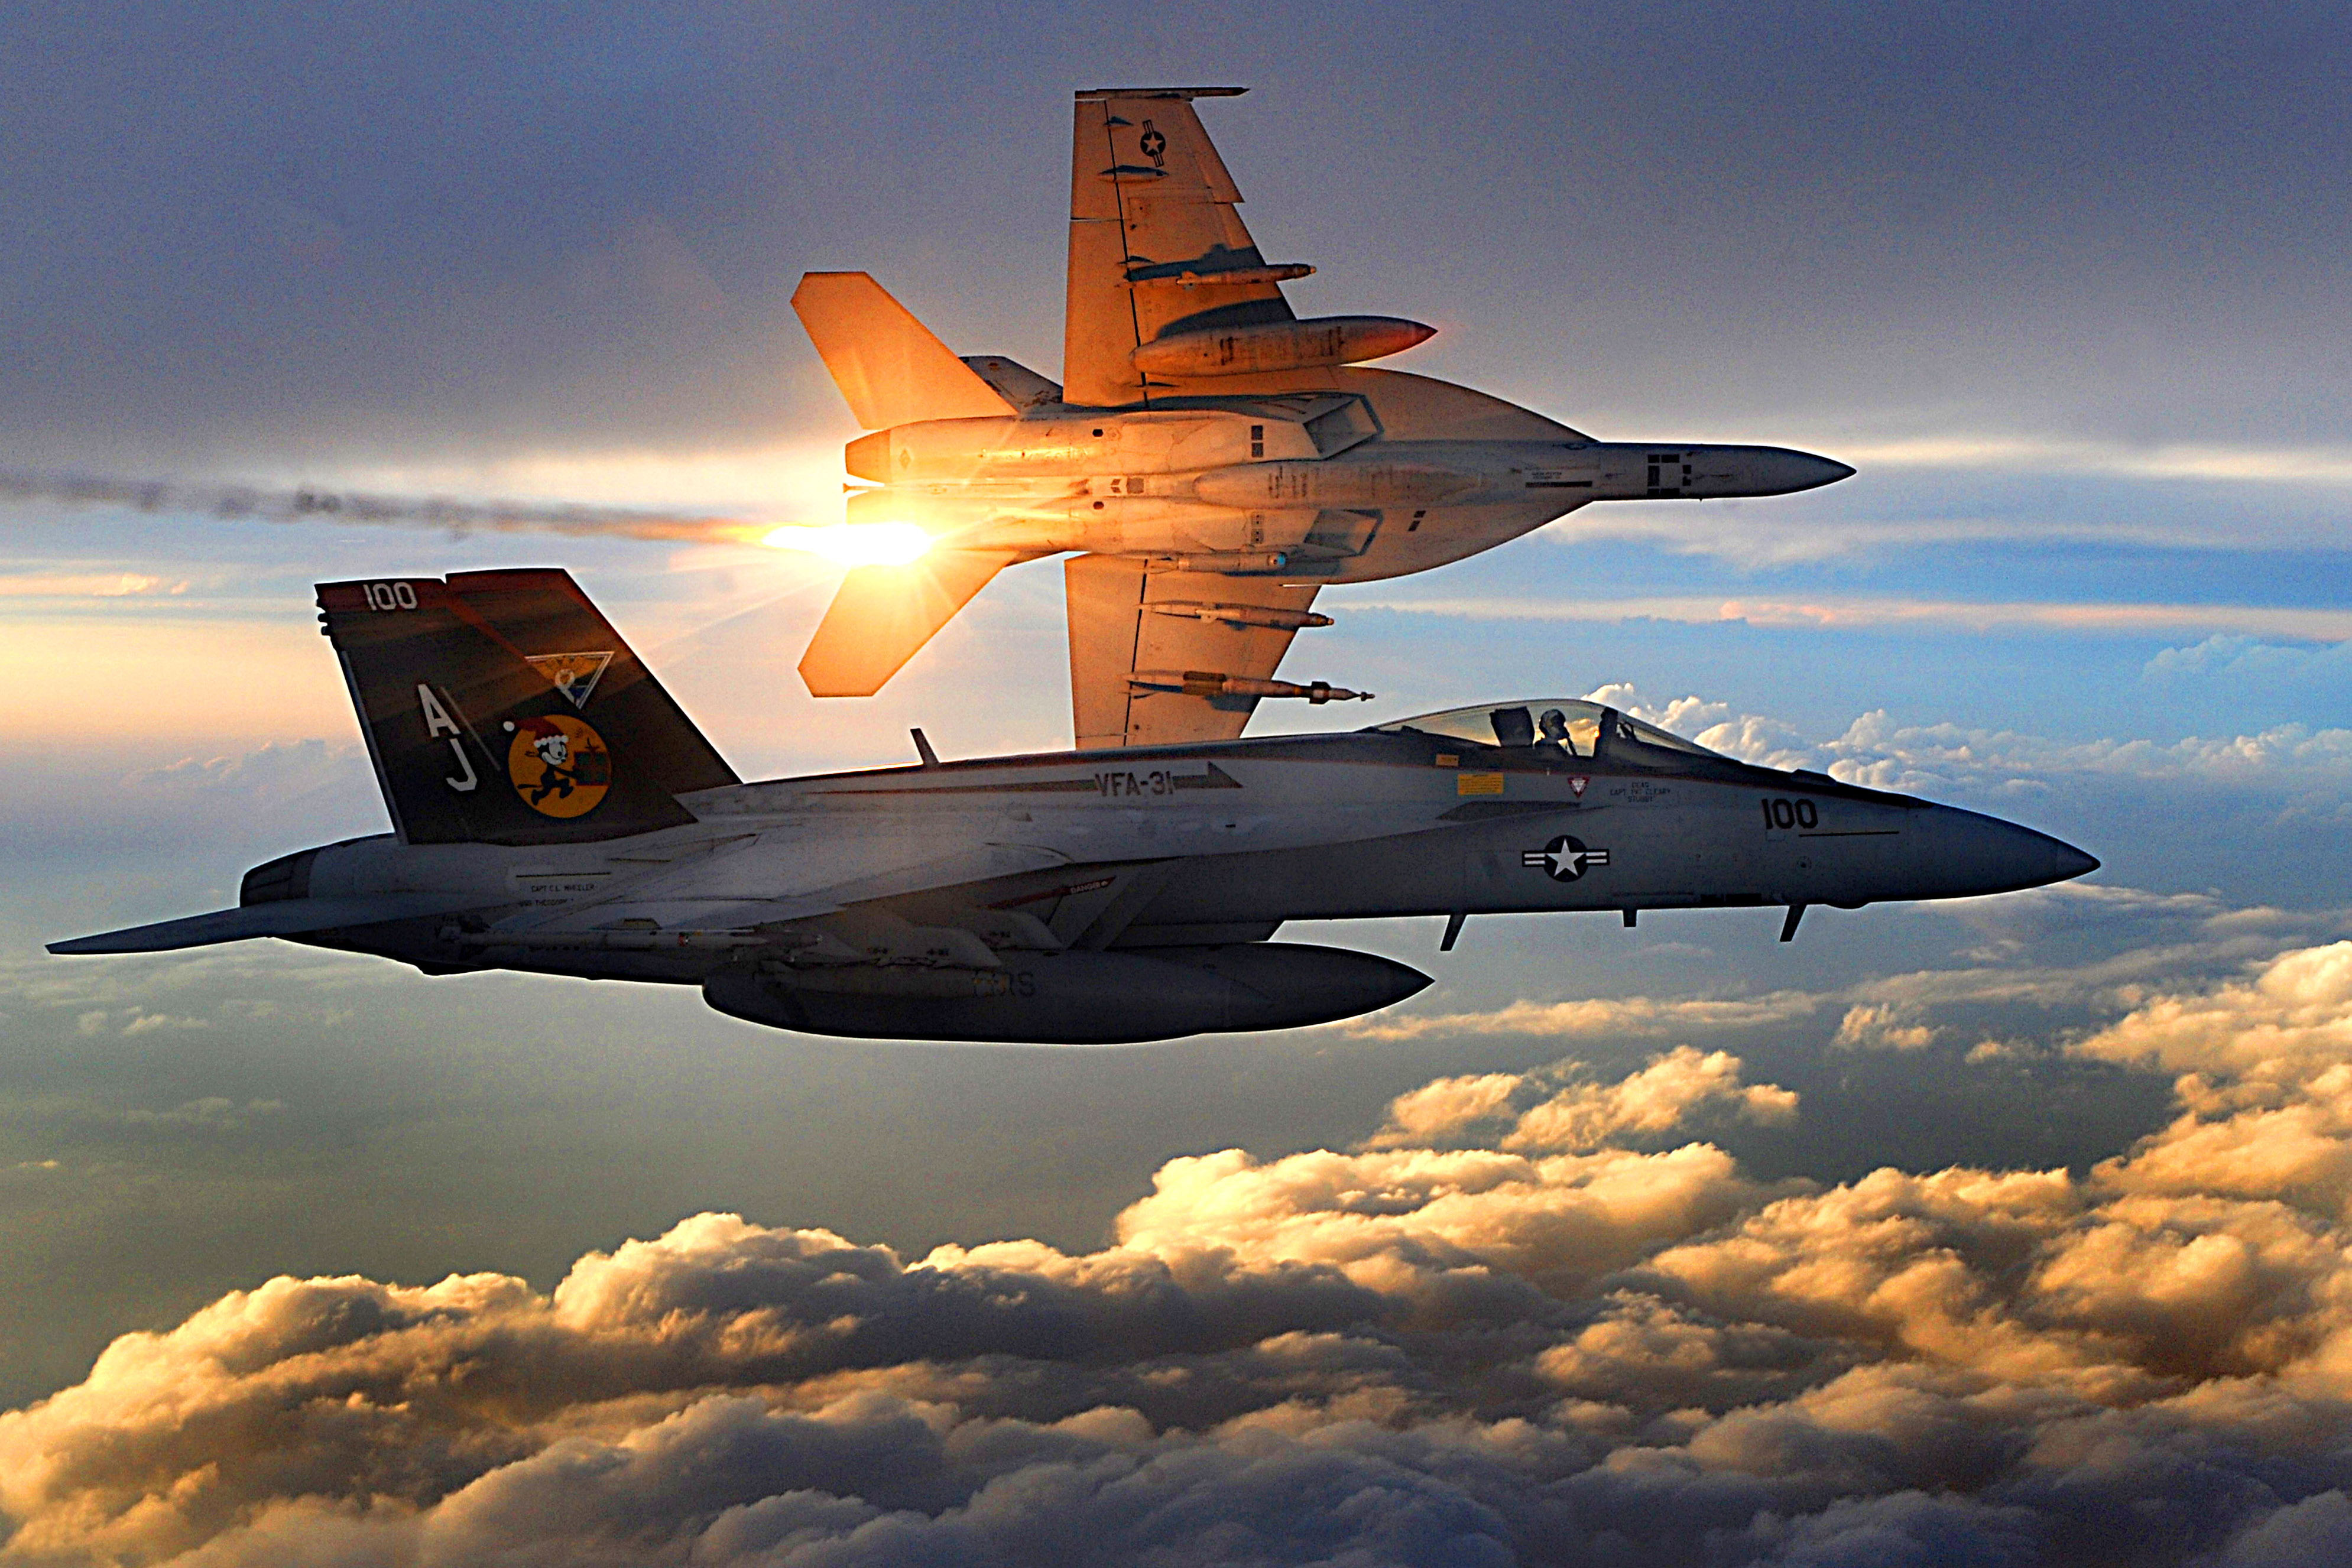
| 16 | F/A-18 Hornet | 3,300 | 10,400 | 6,200 | 16,600 | 23,500 | 6,900 | 4,930 | 100 | 1,250 | 9 | 1 | 1 | -1 | 1 | 1 | 1 | 1 | 1 | 0 | 1 | 7 | 1,480 | 29m | 1983 | 2017 | 34 | McDonnell Douglas | USA | SUPERSONIC |
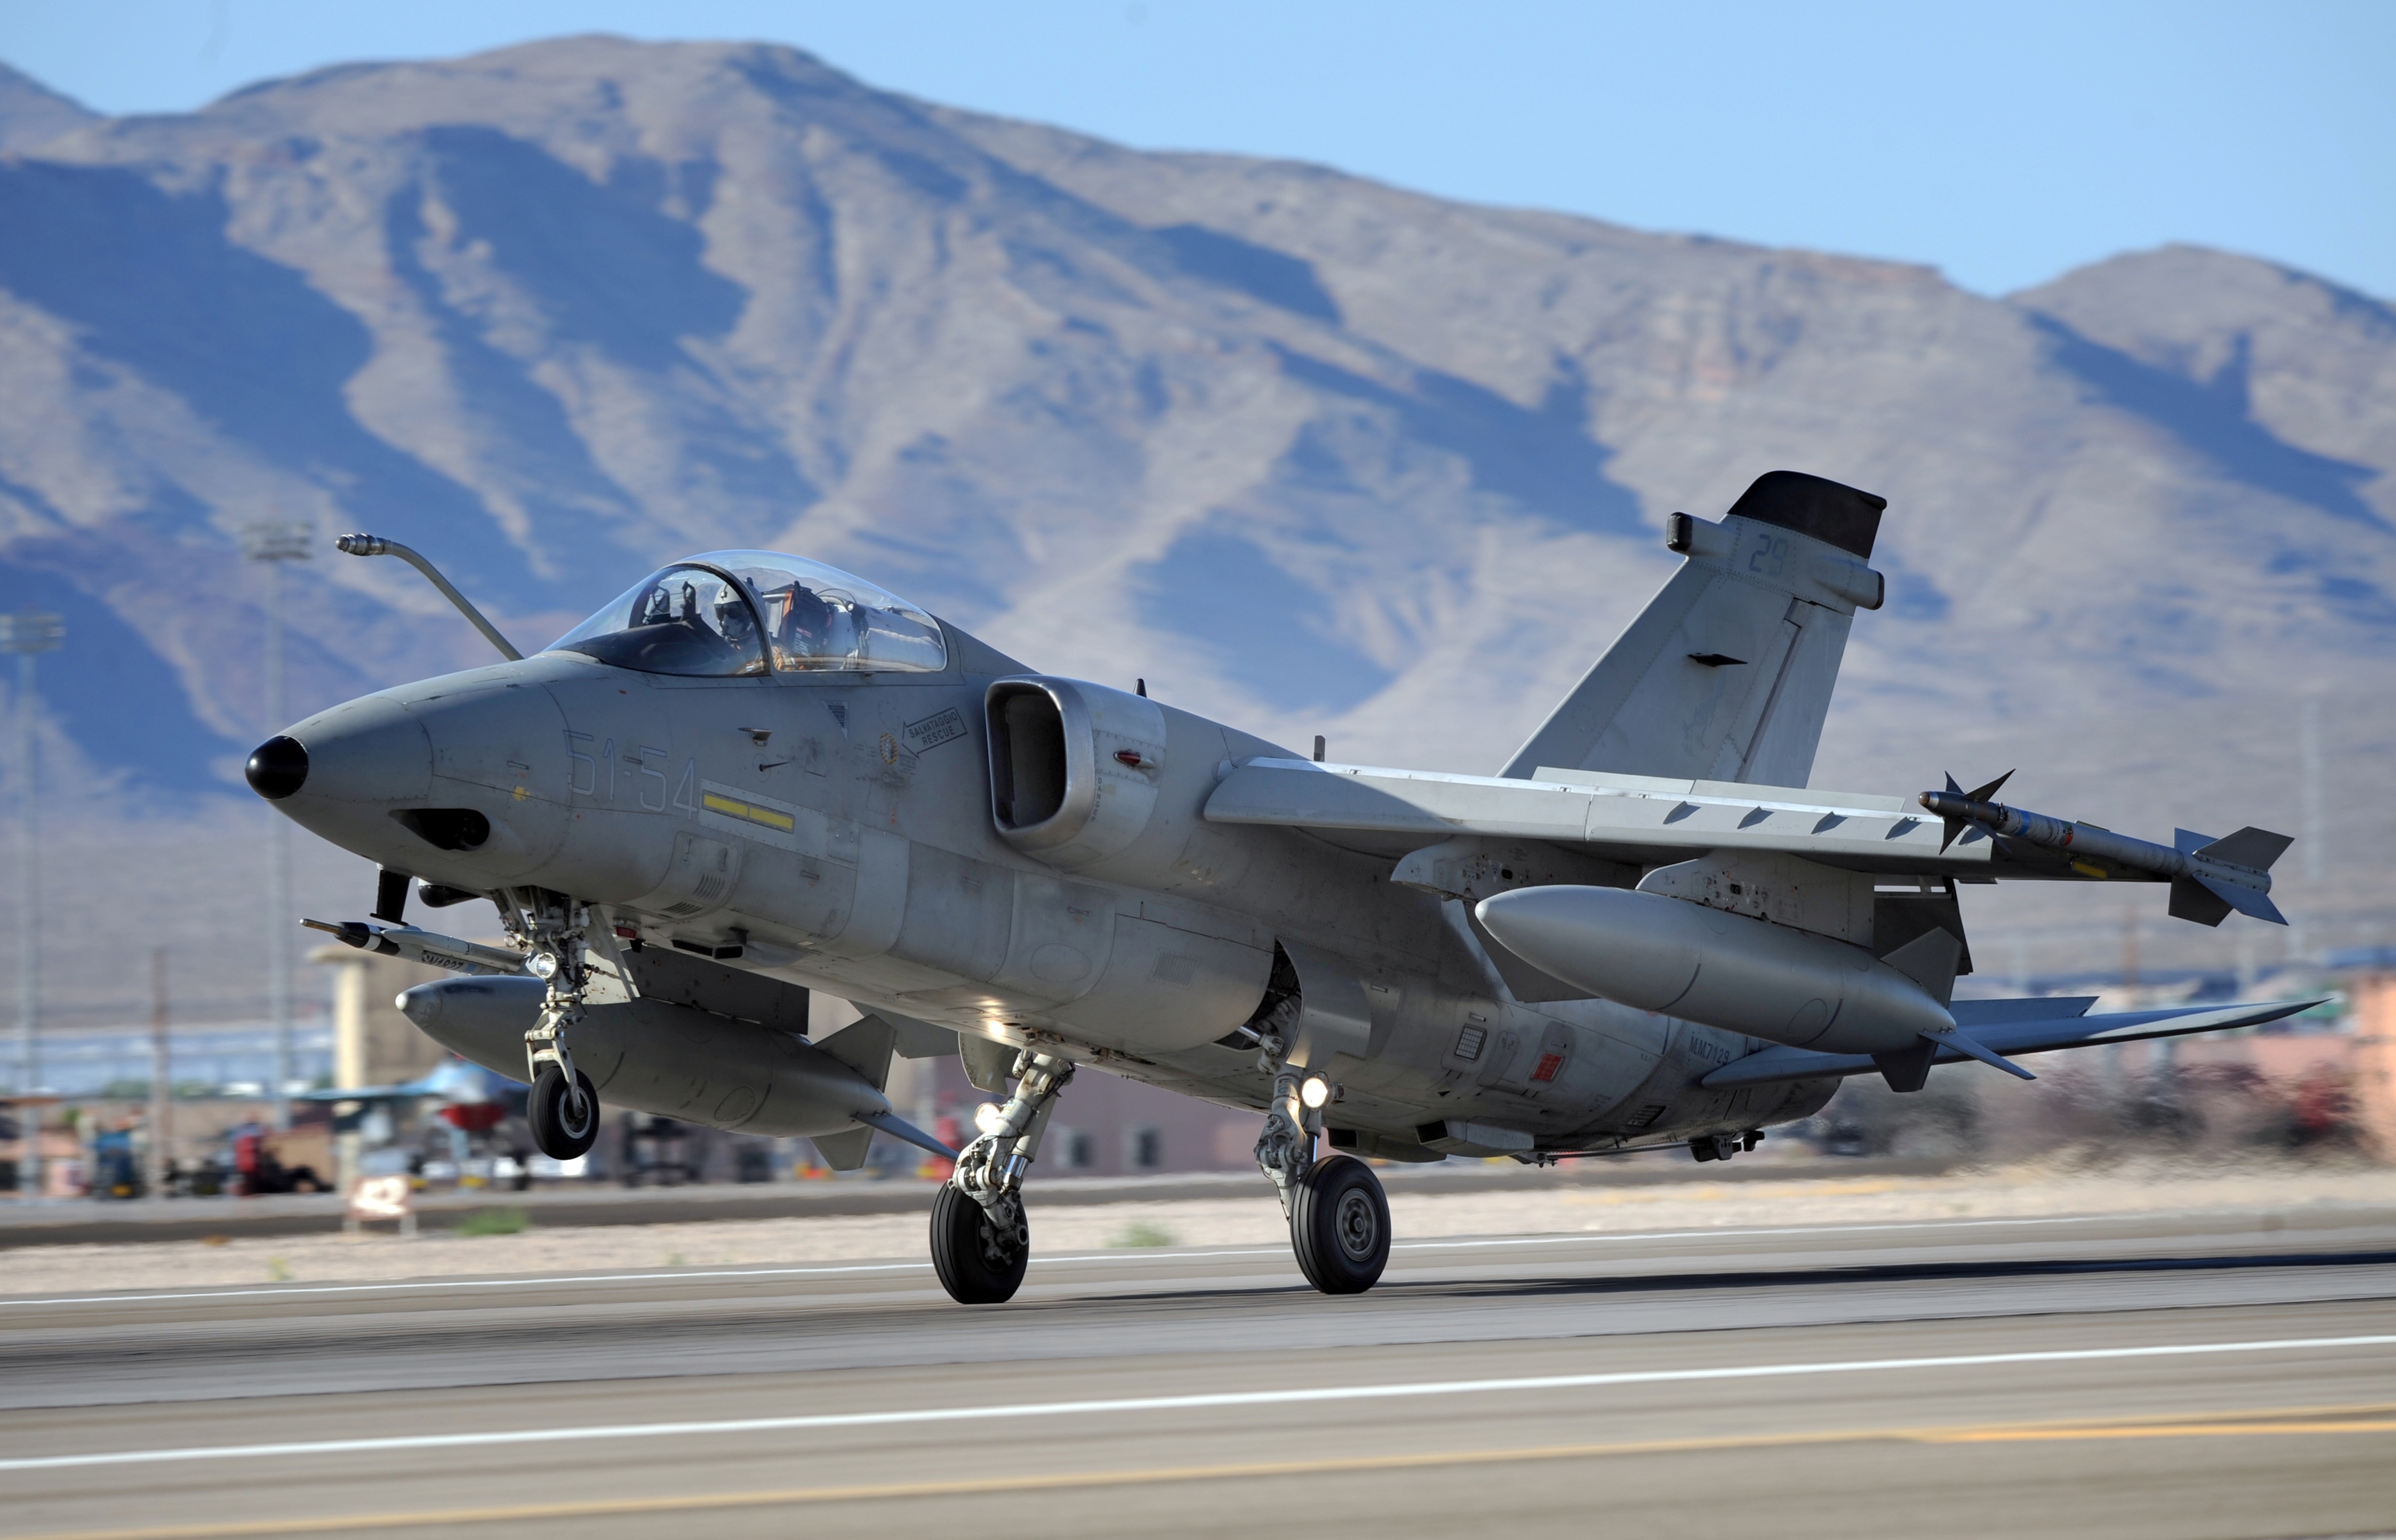
| 17 | AMX | 3,340 | 6,700 | 3,800 | 10,500 | 13,000 | 2,500 | 2,700 | 93 | 950 | 7 | -1 | -1 | -1 | -1 | 1 | -1 | -1 | 1 | -1 | 1 | -4 | 200 | 16.5m | 1986 | 1999 | 13 | AMX Intenational | Italy, Brazil | |
| 18 | F/A-18 SuperHornet | 3,330 | 14,550 | 8,050 | 22,600 | 29,940 | 7,340 | 6,570 | 100 | 1,250 | 11 | 1 | 1 | -1 | 1 | 1 | 1 | 1 | 1 | 0 | 1 | 7 | 500 | 98m | 1995 | 2017 | 22 | Boeing | USA | SUPERSONIC |
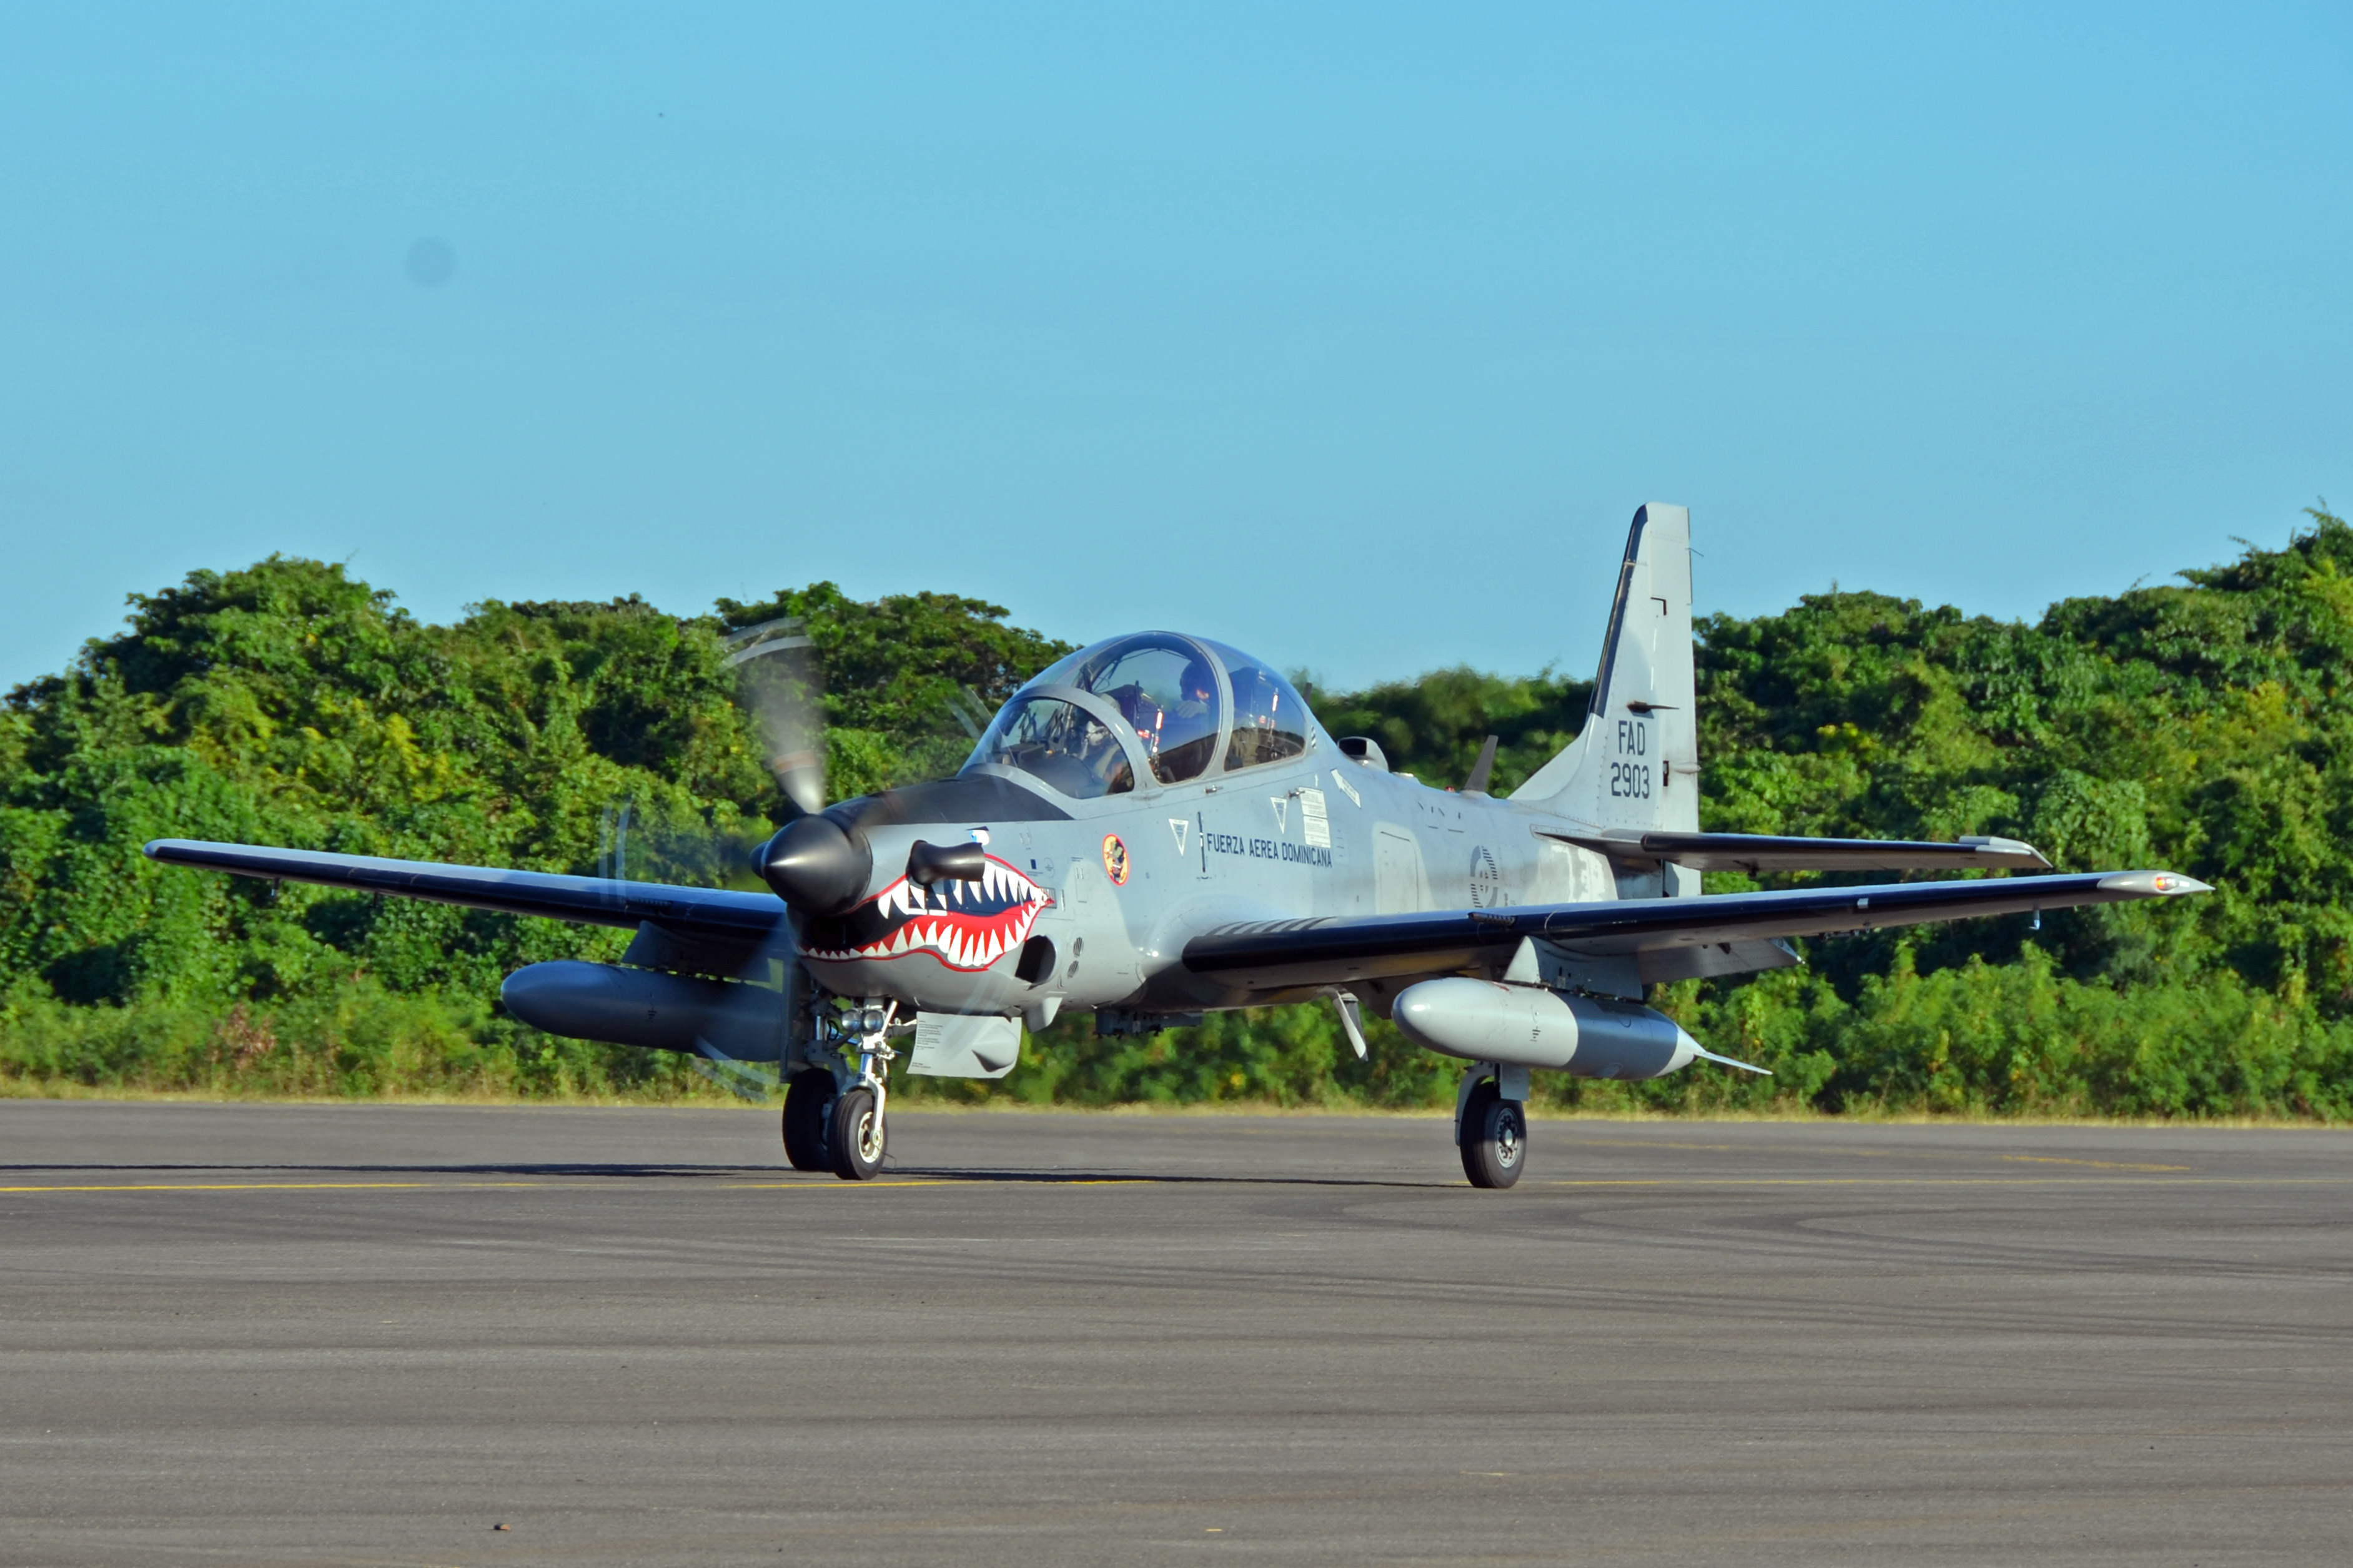
| 19 | EMB 314 SuperTucano | 2,855 | 3,200 | 1,500 | 4,700 | 5,400 | 700 | 455 | 100 | 520 | 5 | -1 | -1 | 2 | -1 | 1 | 1 | -1 | 0 | -1 | 1 | 0 | 200+ | 11.5m | 2003 | 2017 | 14 | Embraer | Brazil | COIN |
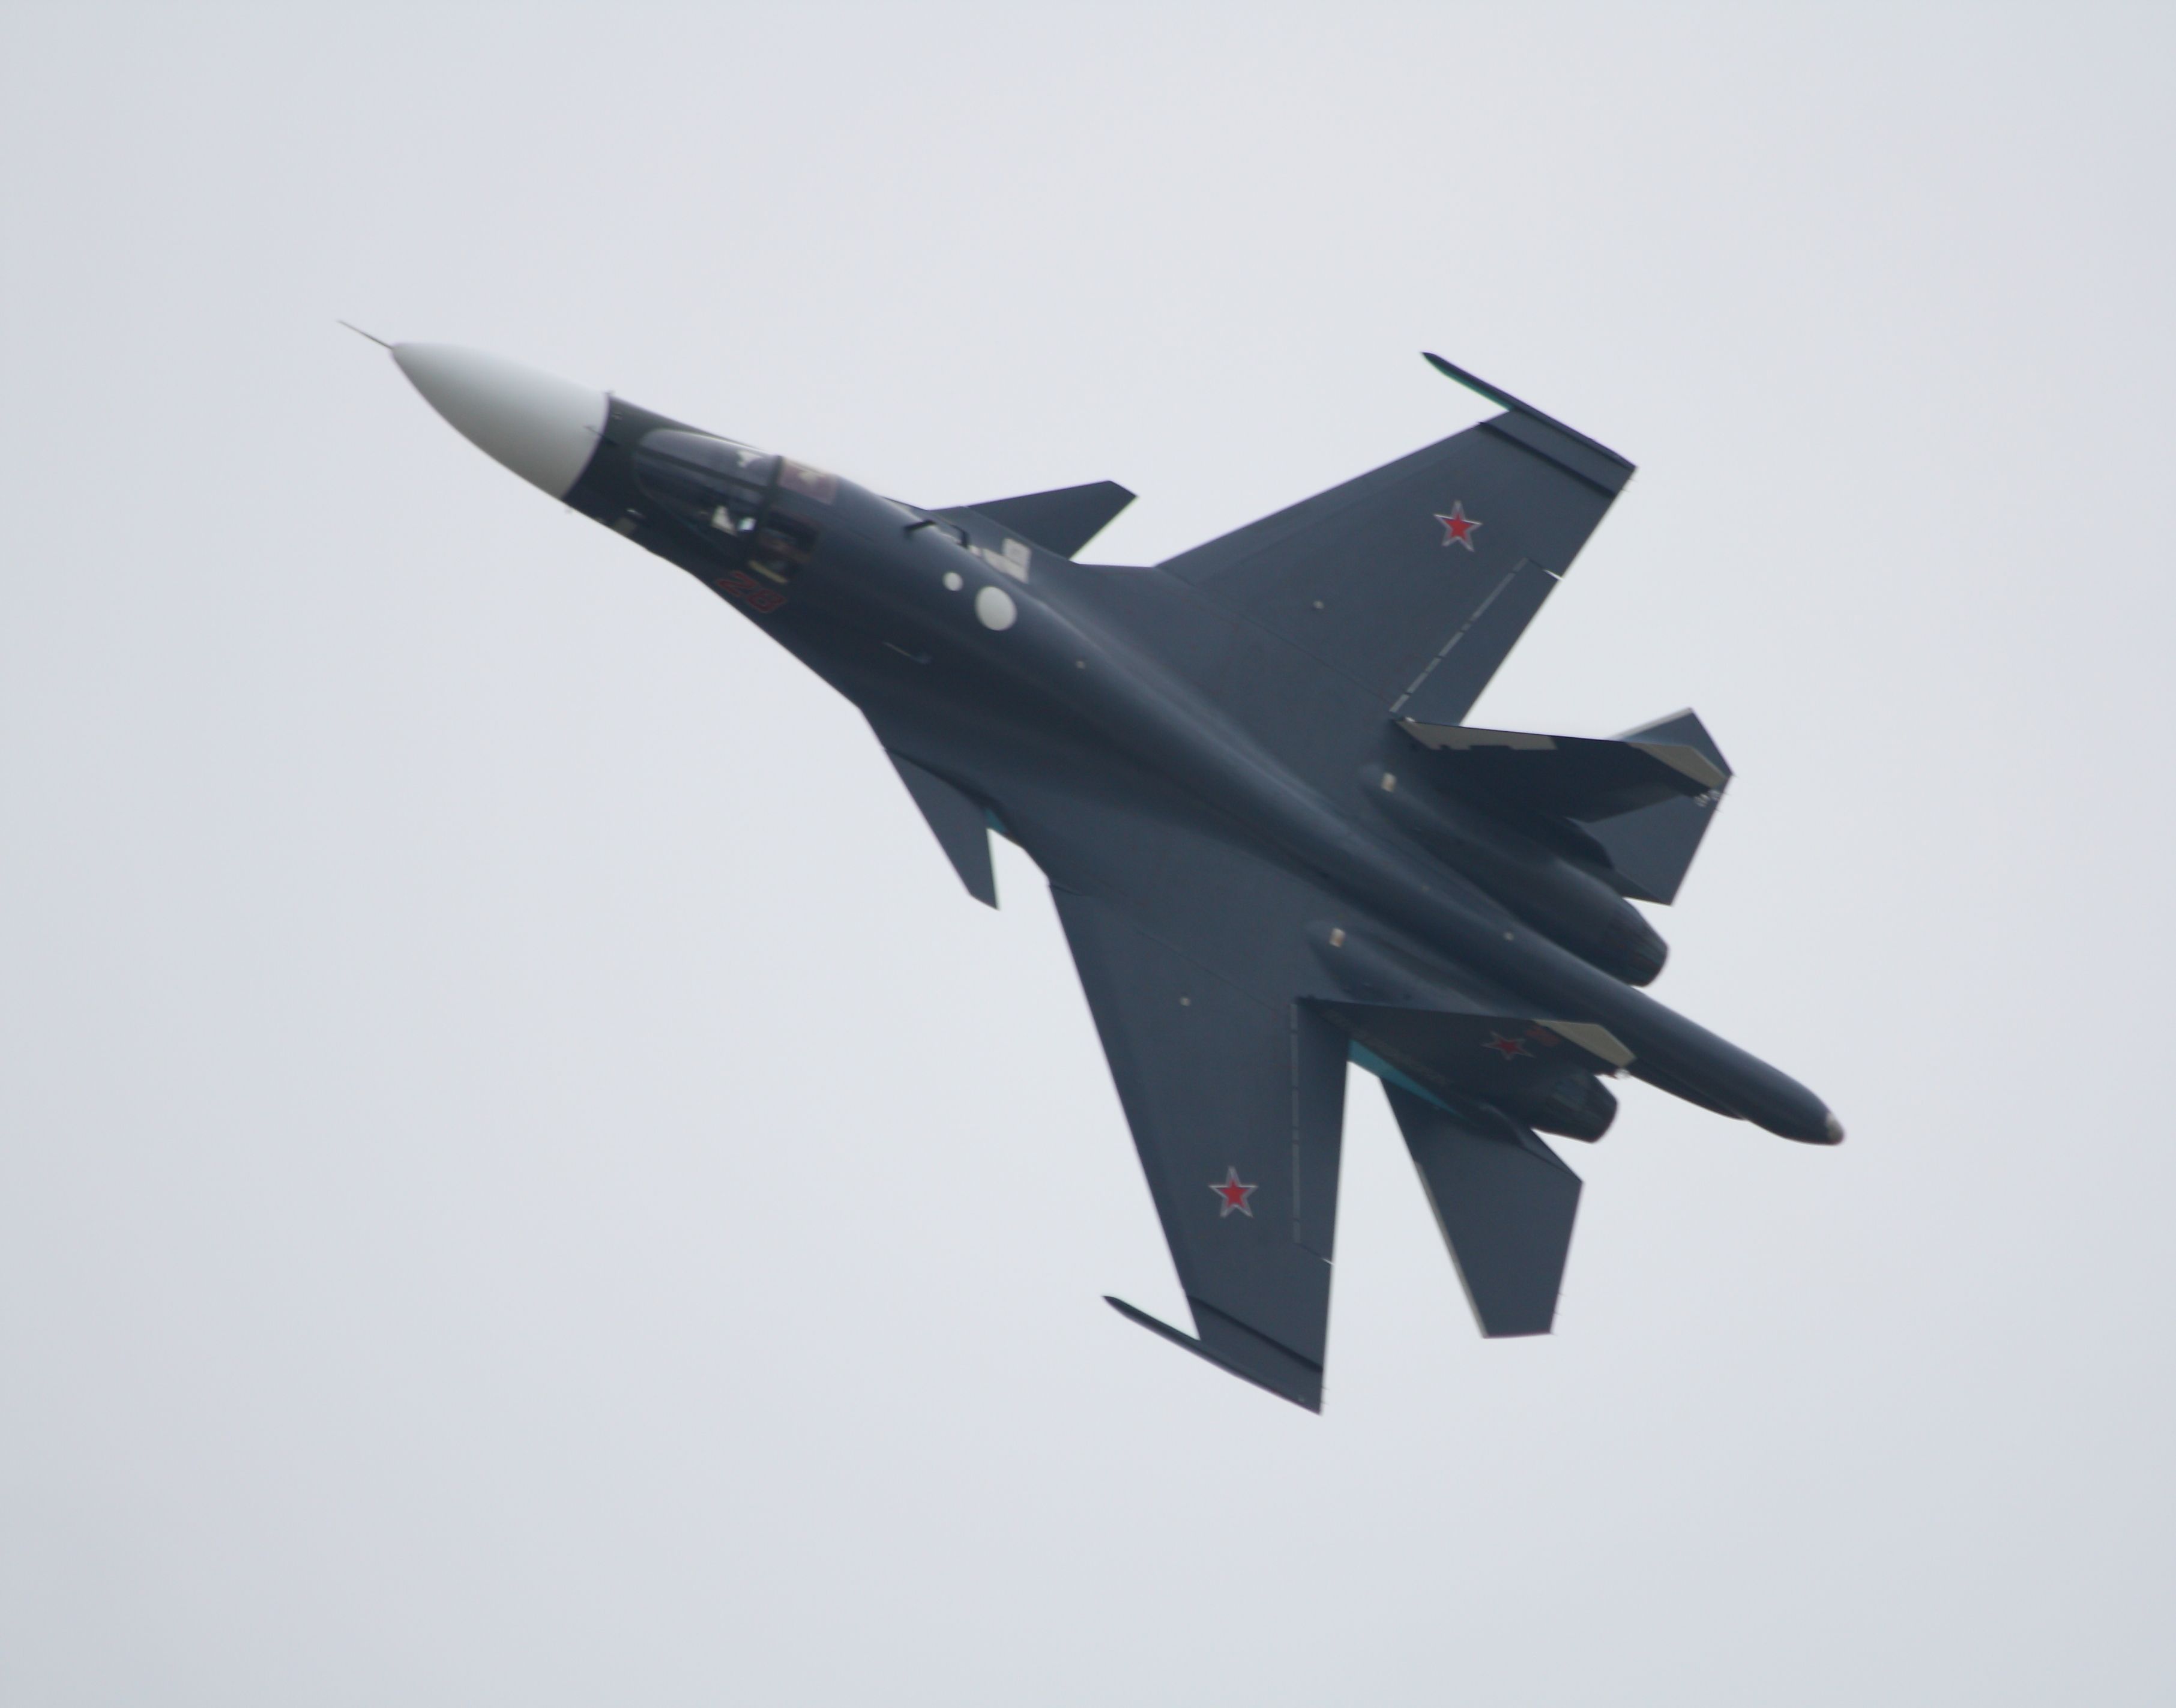
| 20 | SU-34 Fullback | 4,000 | 22,500 | 12,000 | 34,500 | 45,100 | 10,600 | 12,100 | 88 | 1,300 | 12 | 1 | -2 | 2 | 1 | 1 | 1 | 1 | 1 | 2 | 1 | 9 | 100 | 36m | 2006 | 2017 | 11 | Sukhoi | Russia | SUPERSONIC |
| FERRY RANGE / PAYOLAD / CRUISING SPEED SCORE BOARD | ||||||||
| Points | Name | Ferry Range | Points | Name | Payload | Points | Name | Cruising Speed |
| 20 | A-6 Intruder | 5,310km | 20 | AC-130 | 22,520 | 20 | SEPECAT Jaguar | 1,590 |
| 19 | A-7 Corsair | 5,133km | 19 | SU-34 Fullback | 12,000 | 19 | PANAVIA Tornado | 1,480 |
| 18 | AC-130 | 5,000km | 18 | PANAVIA Tornado | 9,000 | 18 | MiG-27 Flogger | 1,400 |
| 17 | SU-34 Fullback | 4000km | 17 | A-6 Intruder | 8,200 | 17 | SU-24 Fencer | 1,310 |
| 16 | A-10 Warthog | 4,150km | 16 | F/A-18 SuperHornet | 8,050 | 16 | SU-34 Fullback | 1,300 |
| 15 | PANAVIA Tornado | 3,890km | 15 | SU-24 Fencer | 8,000 | 15 | F/A-18 SuperHornet | 1,250 |
| 14 | SEPECAT Jaguar | 3,520km | 14 | A-10 Warthog | 7,260 | 14 | F/A-18 Hornet | 1,250 |
| 13 | Average Harrier | 3,396km | 13 | A-7 Corsair | 6,800 | 13 | BAE Hawk | 1,040 |
| 12 | AMX | 3,340km | 12 | F/A-18 Hornet | 6,200 | 12 | AMX | 950 |
| 11 | F/A-18 SuperHornet | 3,330km | 11 | SEPECAT Jaguar | 4,500 | 11 | Alphajet | 890 |
| 10 | F/A-18 Hornet | 3,300km | 10 | A-4 SkyHawk | 4,490 | 10 | Average Harrier | 850 |
| 9 | A-4 SkyHawk | 3,200km | 9 | SU-25 Frogfoot | 4,000 | 9 | A-37 Dragonfly | 790 |
| 8 | BAE Hawk | 3,100km | 8 | MiG-27 Flogger | 4,000 | 8 | A-4 SkyHawk | 760 |
| 7 | Alphajet | 2,940km | 7 | AMX | 3,800 | 7 | A-7 Corsair | 738 |
| 6 | EMB 314 SuperTucano | 2,855km | 6 | Average Harrier | 3,438 | 6 | SU-25 Frogfoot | 650 |
| 5 | SU-24 Fencer | 2,775km | 5 | BAE Hawk | 3,090 | 5 | A-6 Intruder | 628 |
| 4 | MiG-27 Flogger | 2,500km | 4 | Alphajet | 2,500 | 4 | A-10 Warthog | 560 |
| 3 | OV-10 Bronco | 2,300km | 3 | EMB 314 SuperTucano | 1,500 | 3 | AC-130 | 520 |
| 2 | SU-25 Frogfoot | 2,250km | 2 | A-37 Dragonfly | 1,230 | 2 | EMB 314 SuperTucano | 520 |
| 1 | A-37 Dragonfly | 1,480km | 1 | OV-10 Bronco | 500 | 1 | OV-10 Bronco | 450 |
| POINTS OBTAINED | ||||||
| Name | Ferry Range | Payload | Cruising Speed | Score W/O Y/N Points | Yes/No Points | Score W/ Y/N Points |
| A-4 SkyHawk | 9 | 10 | 8 | 27 | -4 | 23 |
| A-6 Intruder | 20 | 17 | 5 | 42 | 4 | 46 |
| A-37 Dragonfly | 1 | 2 | 9 | 12 | 1 | 13 |
| A-7 Corsair | 19 | 13 | 7 | 39 | 0 | 39 |
| OV-10 Bronco | 3 | 1 | 1 | 5 | 0 | 5 |
| Average Harrier | 13 | 6 | 10 | 29 | -5 | 24 |
| SU-24 Fencer | 5 | 15 | 17 | 37 | 4 | 41 |
| AC-130 | 18 | 20 | 3 | 41 | 4 | 45 |
| SEPECAT Jaguar | 14 | 11 | 20 | 45 | 9 | 54 |
| MiG-27 Flogger | 4 | 8 | 18 | 30 | -1 | 29 |
| A-10 Warthog | 16 | 14 | 4 | 34 | -2 | 32 |
| Alphajet | 7 | 4 | 11 | 22 | -9 | 13 |
| BAE Hawk | 8 | 5 | 13 | 26 | -8 | 18 |
| SU-25 Frogfoot | 2 | 9 | 6 | 17 | 0 | 17 |
| PANAVIA Tornado | 15 | 18 | 19 | 52 | 7 | 59 |
| F/A-18 Hornet | 10 | 12 | 14 | 36 | 7 | 43 |
| AMX | 12 | 7 | 12 | 31 | -4 | 27 |
| F/A-18 SuperHornet | 11 | 16 | 15 | 42 | 7 | 49 |
| EMB 314 SuperTucano | 6 | 3 | 2 | 11 | 0 | 11 |
| SU-34 Fullback | 17 | 19 | 16 | 52 | 9 | 61 |
| SCORE W/O Y/N POINTS | ||
| Name | Total Points | Notes |
| PANAVIA Tornado | 52 | SUPERSONIC |
| SU-34 Fullback | 52 | SUPERSONIC |
| SEPECAT Jaguar | 45 | SUPERSONIC |
| A-6 Intruder | 42 | |
| F/A-18 SuperHornet | 42 | SUPERSONIC |
| AC-130 | 41 | CAS |
| A-7 Corsair | 39 | |
| SU-24 Fencer | 37 | SUPERSONIC |
| F/A-18 Hornet | 36 | SUPERSONIC |
| A-10 Warthog | 34 | CAS |
| AMX | 31 | |
| MiG-27 Flogger | 30 | SUPERSONIC |
| Average Harrier | 29 | |
| A-4 SkyHawk | 27 | |
| BAE Hawk | 26 | trainer |
| Alphajet | 22 | trainer, light attack |
| SU-25 Frogfoot | 17 | CAS |
| A-37 Dragonfly | 12 | COIN |
| EMB 314 SuperTucano | 11 | COIN |
| OV-10 Bronco | 5 | COIN |
| FINAL SCORE (W/ Y/N POINTS) | ||
| Name | Total Points | Notes |
| SU-34 Fullback | 61 | SUPERSONIC |
| PANAVIA Tornado | 59 | SUPERSONIC |
| SEPECAT Jaguar | 54 | SUPERSONIC |
| F/A-18 SuperHornet | 49 | SUPERSONIC |
| A-6 Intruder | 46 | |
| AC-130 | 45 | CAS |
| F/A-18 Hornet | 43 | SUPERSONIC |
| SU-24 Fencer | 41 | SUPERSONIC |
| A-7 Corsair | 39 | |
| A-10 Warthog | 32 | CAS |
| MiG-27 Flogger | 29 | SUPERSONIC |
| AMX | 27 | |
| Average Harrier | 24 | |
| A-4 SkyHawk | 23 | |
| BAE Hawk | 18 | trainer |
| SU-25 Frogfoot | 17 | CAS |
| A-37 Dragonfly | 13 | COIN |
| Alphajet | 13 | trainer, light attack |
| EMB 314 SuperTucano | 11 | COIN |
| OV-10 Bronco | 5 | COIN |
AC-130
Alphajet
AMX
Bronco
Corsair
Dragonfly
Fencer
Flogger
Frogfoot
Fullback
Harrier
Hawk
Hornet
Intruder
Jaguar
Skyhawk
Super Tucano
SuperHornet
Tornado
Warthog